| Start Page |
|
 |
| Start Page |
|
|
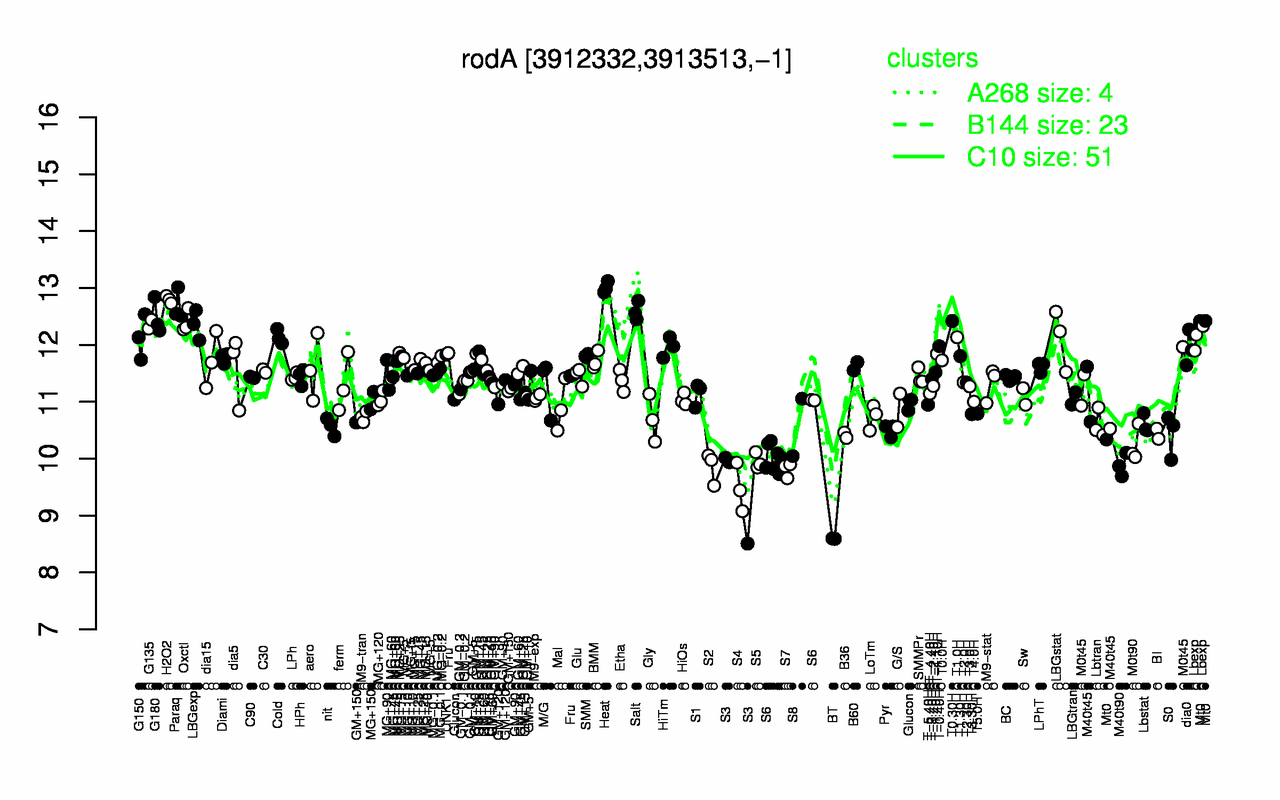
| Heat | H2O2 | Paraq | Salt | G180 | T0.30H | Oxctl | G135 | LBGexp | Cold |
| 13 | 12.8 | 12.7 | 12.6 | 12.5 | 12.4 | 12.4 | 12.4 | 12.4 | 12.1 |
| BT | S4 | S3 | S7 | S2 | M40t90 | S5 | S6 | M0t90 | B36 |
| 8.59 | 9.48 | 9.49 | 9.81 | 9.85 | 9.89 | 9.95 | 10.2 | 10.2 | 10.4 |