| Start Page |
|
 |
| Start Page |
|
|
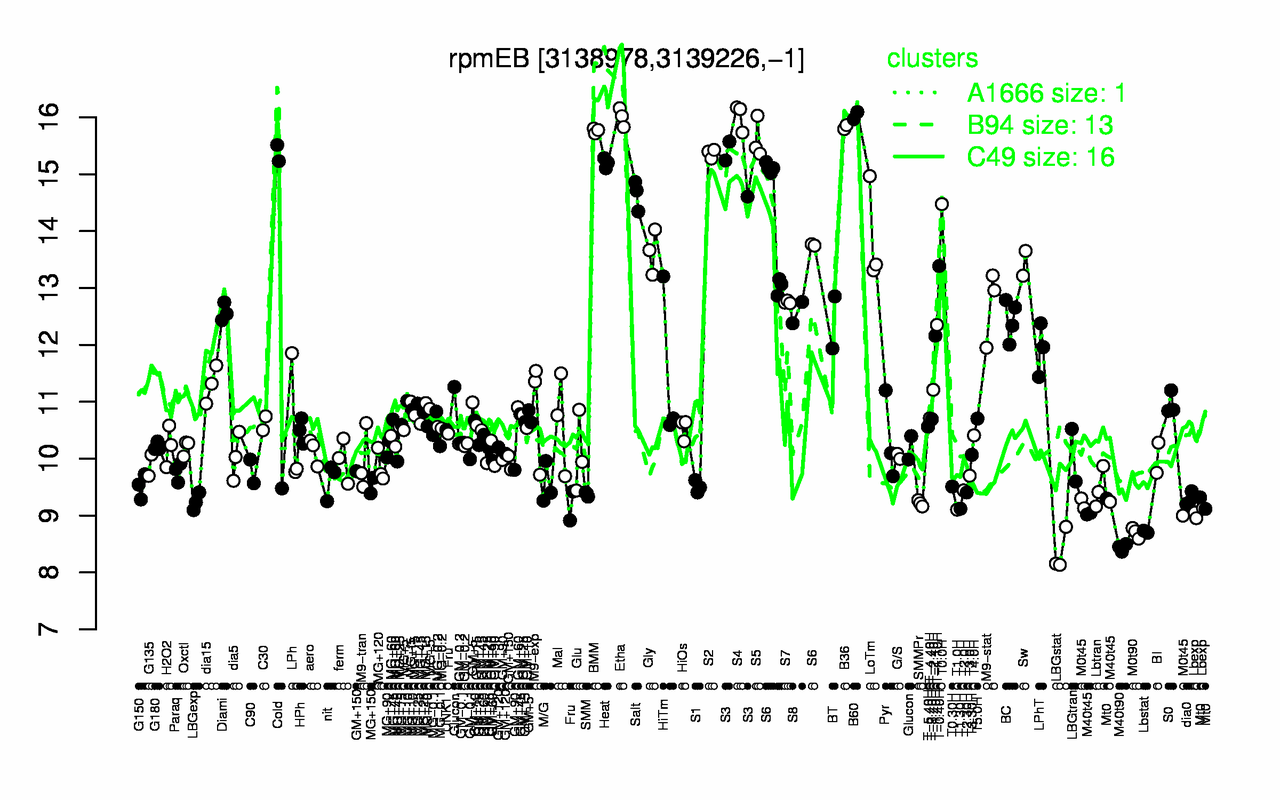
| B60 | S4 | Etha | B36 | BMM | S5 | S2 | Heat | S3 | Salt |
| 16 | 16 | 16 | 15.8 | 15.8 | 15.6 | 15.4 | 15.2 | 15.1 | 14.6 |
| LBGstat | M40t90 | M0t90 | Lbstat | Lbexp | M40t45 | T1.0H | T1.30H | M0t45 | SMMPr |
| 8.36 | 8.44 | 8.7 | 8.72 | 9.04 | 9.1 | 9.1 | 9.12 | 9.14 | 9.22 |