| Start Page |
|
 |
| Start Page |
|
|
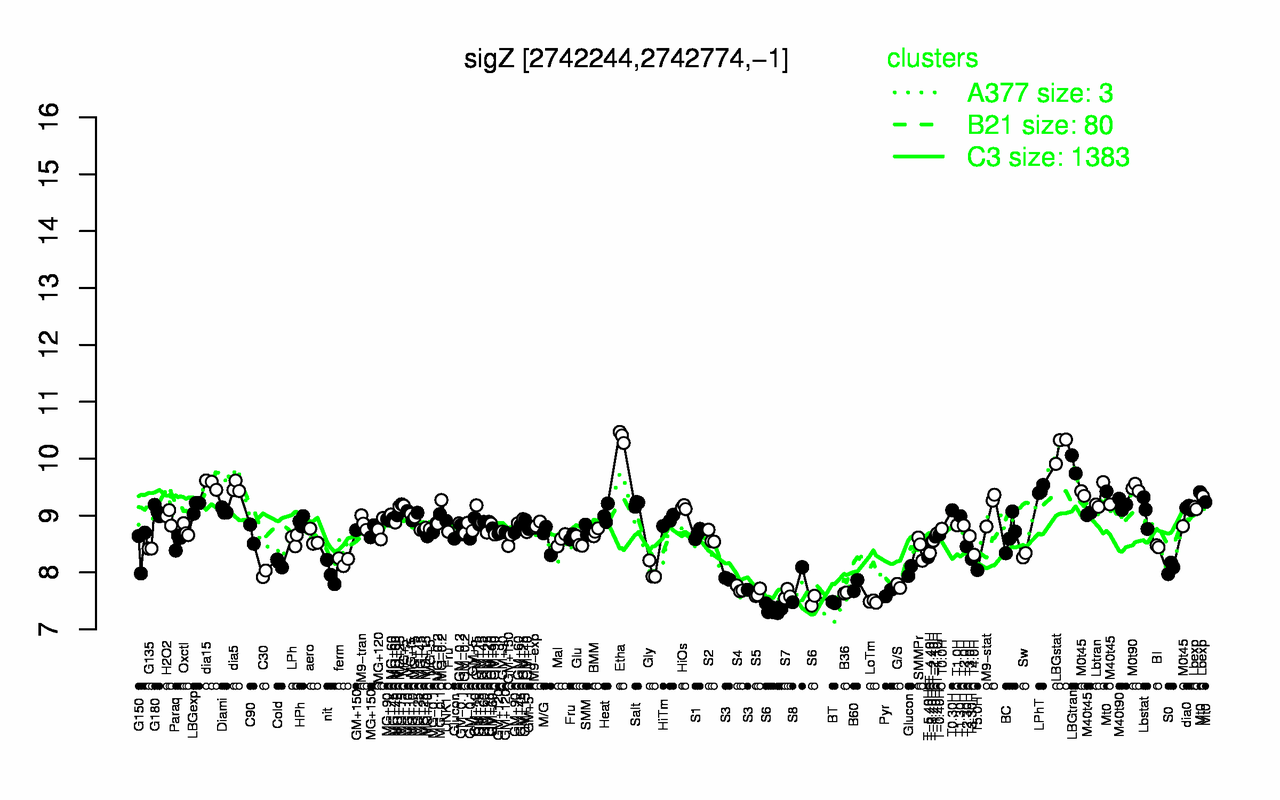
| Etha | LBGstat | LBGtran | dia15 | dia5 | M0t90 | LPhT | Mt0 | Lbtran | Salt |
| 10.4 | 10.2 | 9.9 | 9.55 | 9.5 | 9.49 | 9.45 | 9.36 | 9.31 | 9.21 |
| S6 | BT | LoTm | S7 | S5 | B36 | Pyr | S4 | G/S | B60 |
| 7.39 | 7.47 | 7.49 | 7.61 | 7.64 | 7.64 | 7.66 | 7.71 | 7.76 | 7.77 |