| Start Page |
|
 |
| Start Page |
|
|
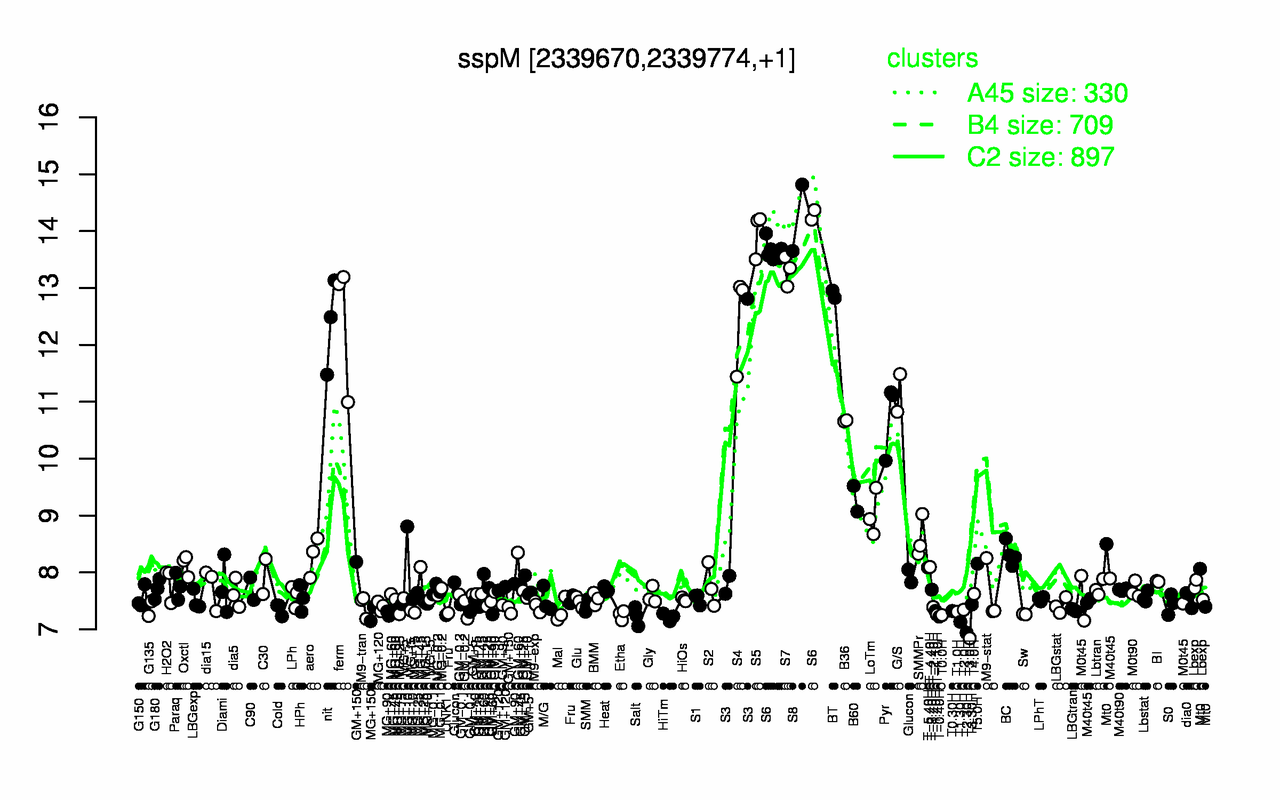
| S8 | S5 | S6 | S7 | BT | S4 | ferm | nit | G/S | Pyr |
| 14.2 | 14 | 13.8 | 13.3 | 12.9 | 12.5 | 12.4 | 12.4 | 11.2 | 10.7 |
| T3.0H | T2.30H | T1.30H | HiTm | T-0.40H | Salt | UNK1 | Etha | T0.0H | T-1.10H |
| 6.84 | 6.94 | 7.13 | 7.22 | 7.22 | 7.23 | 7.25 | 7.25 | 7.25 | 7.26 |