B. subtilis Expression Data Browser
Start Page
B. subtilis Expression Data Browser
Gene/Segment:
tlpA
Locus Tag:
BSU31250
Details about tlpA
Show/Hide
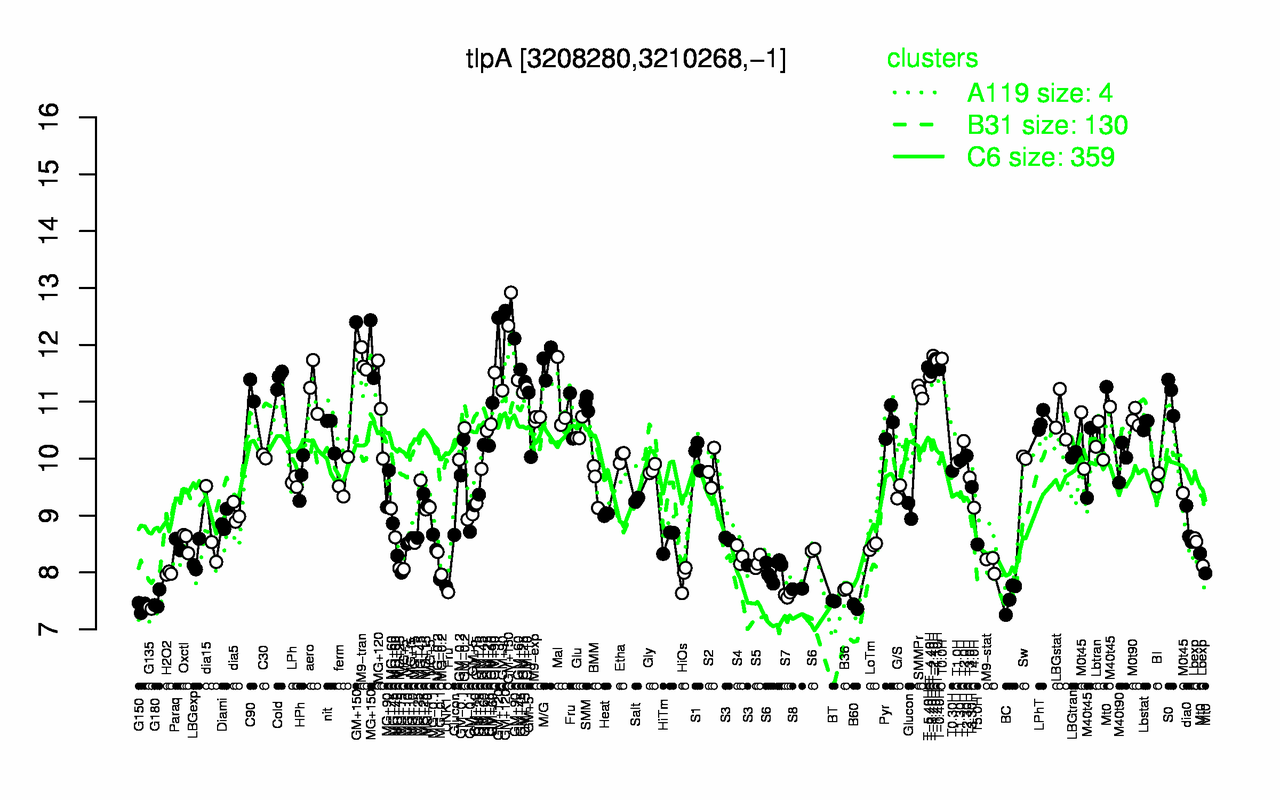
Highest Expression Conditions
GM+150
GM+120
MG+150
T-2.40H
T0.0H
T-1.40H
T-1.10H
M9-tran
M/G
T-5.40H
12.6
12.5
11.9
11.8
11.8
11.8
11.7
11.7
11.7
11.6
Lowest Expression Conditions
G135
B60
G150
BT
G180
BC
S7
B36
S8
UNK1
7.37
7.4
7.4
7.5
7.51
7.58
7.6
7.71
7.71
7.75
Most Positively Correlated Segments
S1190
ybdO
yomK
yolA
yjcQ
yolB
yjcP
yscB
yqaR
mcpA
0.94
0.91
0.82
0.81
0.81
0.8
0.8
0.79
0.78
0.77
Most Negatively Correlated Segments
dtpT
ykpC
bofA
ypuI
yckC
stoA
yunB
S662
yitT
glpK
-0.63
-0.58
-0.56
-0.55
-0.55
-0.55
-0.55
-0.54
-0.54
-0.54
Expression Profile of Segment tlpA
Show/Hide
Annotation of Gene tlpA
Show/Hide
function
16.12: Sense
inference
ab initio prediction:AMIGene:2.0
codon_start
1
product
methyl-accepting chemotaxis protein
transl_table
11
note
Evidence 1a: Function experimentally demonstrated in the studied strain; PubMedId: 10825179, 14563871, 8188684; Product type rc: receptor
db_xref
GI:2635609
protein_id
CAB15103.1
Genomic View of Gene/Segment tlpA
Show/Hide
(Legend)
Browse Genome Context