| Start Page |
|
 |
| Start Page |
|
|
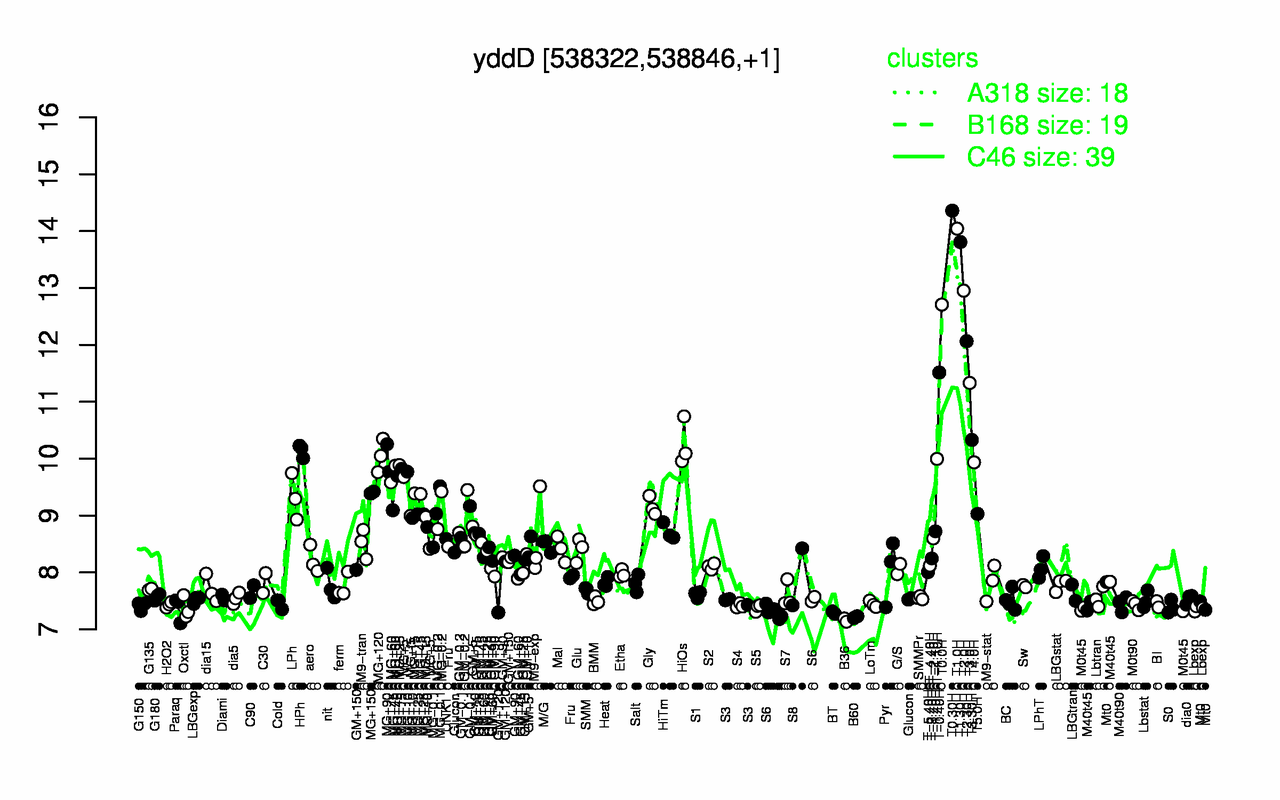
| T0.30H | T1.0H | T1.30H | T2.0H | T0.0H | T2.30H | T-0.40H | T3.0H | T3.30H | HiOs |
| 14.4 | 14 | 13.8 | 13 | 12.7 | 12.1 | 11.5 | 11.3 | 10.3 | 10.3 |
| B36 | B60 | BT | M0t45 | S6 | Lbexp | Paraq | Oxctl | S5 | S0 |
| 7.16 | 7.21 | 7.29 | 7.34 | 7.36 | 7.36 | 7.37 | 7.38 | 7.38 | 7.39 |