| Start Page |
|
 |
| Start Page |
|
|
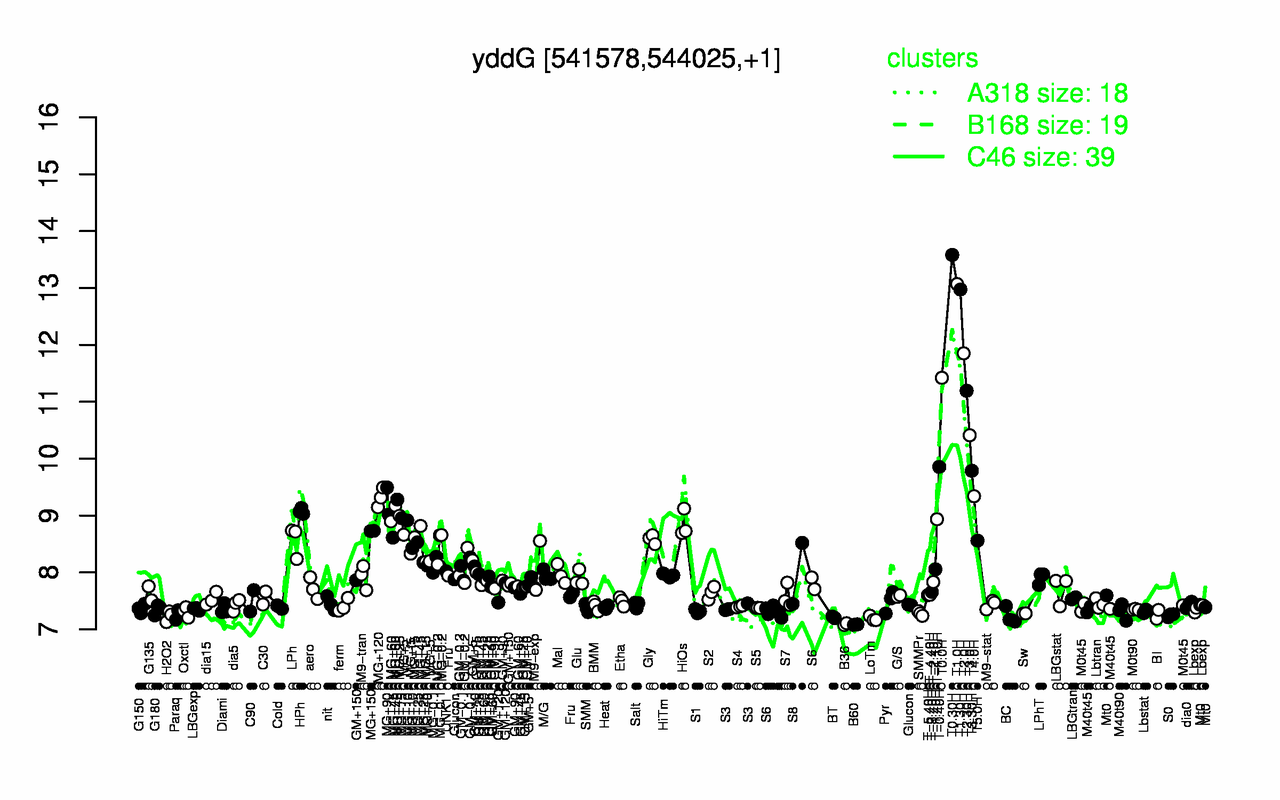
| T0.30H | T1.0H | T1.30H | T2.0H | T0.0H | T2.30H | T3.0H | T-0.40H | T3.30H | T4.0H |
| 13.6 | 13.1 | 13 | 11.9 | 11.4 | 11.2 | 10.4 | 9.86 | 9.79 | 9.34 |
| B60 | B36 | LoTm | BT | BC | H2O2 | S0 | Paraq | BI | SMMPr |
| 7.08 | 7.09 | 7.19 | 7.21 | 7.22 | 7.23 | 7.25 | 7.25 | 7.26 | 7.28 |