| Start Page |
|
 |
| Start Page |
|
|
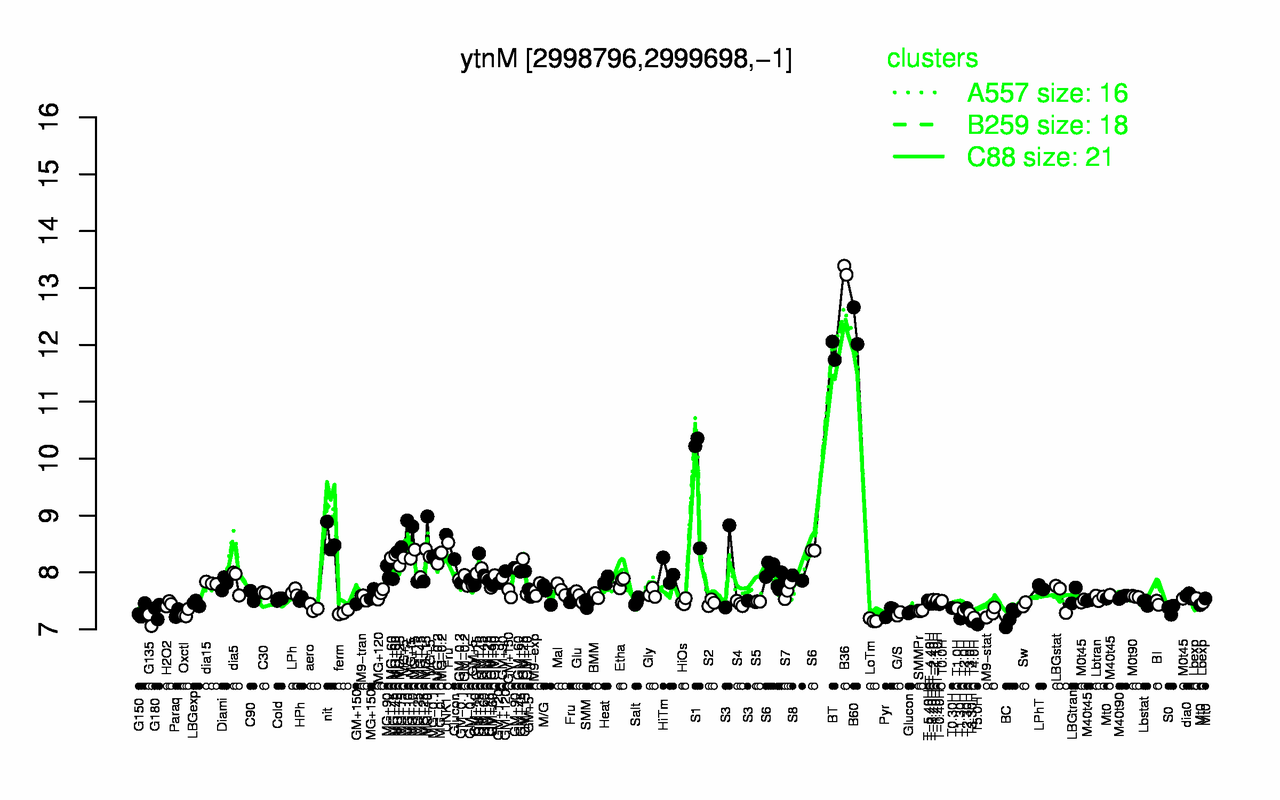
| B36 | B60 | BT | S1 | MG+10 | UNK1 | nit | MG+15 | MG+60 | MG-0.1 |
| 13.3 | 12.3 | 11.9 | 9.67 | 8.9 | 8.66 | 8.59 | 8.42 | 8.28 | 8.27 |
| T5.0H | T3.30H | G135 | LoTm | T1.30H | T4.0H | BC | G/S | Oxctl | T3.0H |
| 7.09 | 7.15 | 7.16 | 7.16 | 7.19 | 7.21 | 7.22 | 7.27 | 7.28 | 7.28 |