B. subtilis Expression Data Browser
Start Page
B. subtilis Expression Data Browser
Gene/Segment:
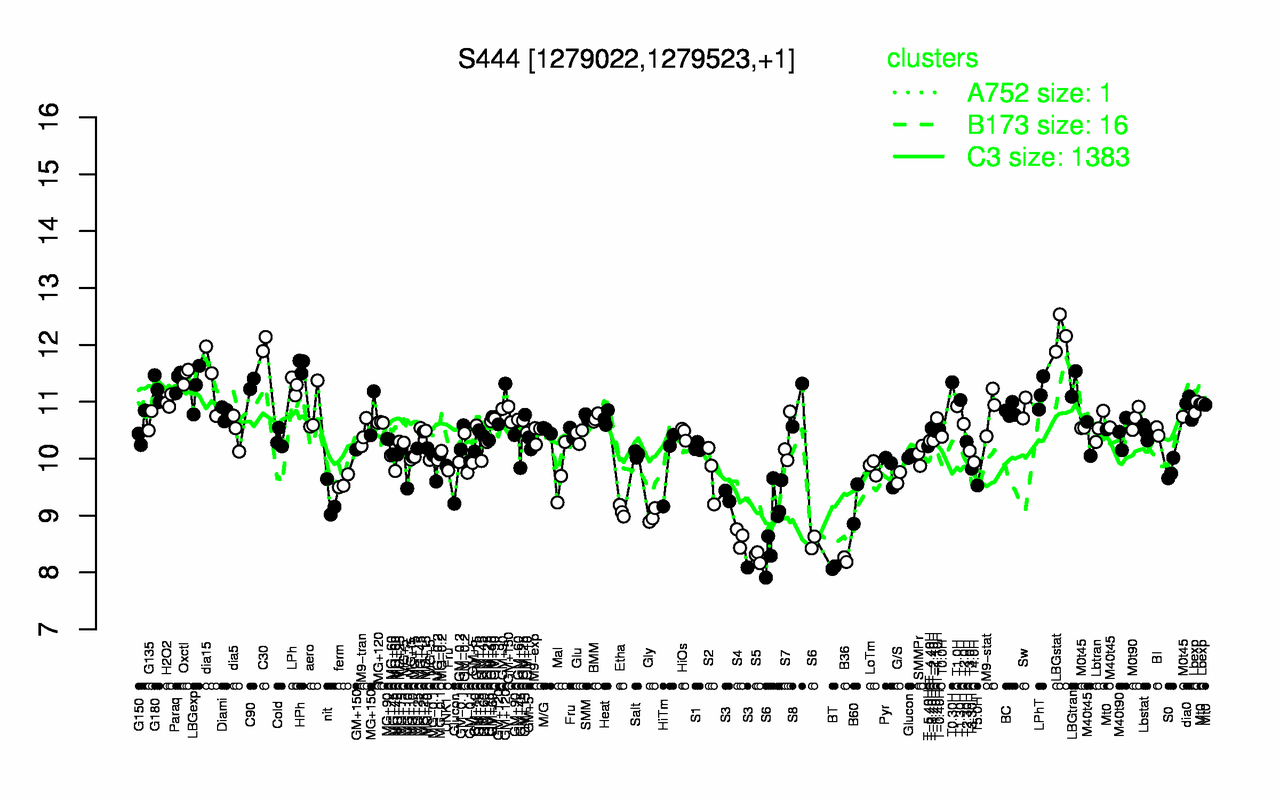
S444
Locus Tag:
new_1279022_1279523
Details about S444
Show/Hide
Highest Expression Conditions
LBGstat
C30
HPh
Oxctl
dia15
Paraq
T0.30H
C90
LBGtran
LPh
12.2
12
11.6
11.5
11.4
11.4
11.3
11.3
11.3
11.3
Lowest Expression Conditions
BT
B36
S5
S4
S6
S3
Gly
Etha
B60
nit
8.08
8.23
8.28
8.61
8.8
8.92
8.99
9.08
9.2
9.27
Most Positively Correlated Segments
S348
S1161
lrpB
yrhF
lytG
ydcH
ywzC
S1329
yjdI
sfp
0.8
0.77
0.76
0.75
0.73
0.73
0.72
0.72
0.71
0.71
Most Negatively Correlated Segments
sodC
mpr
coxA
S1055
sspN
ynzL
S1170
yjfA
tlp
ybfJ
-0.66
-0.66
-0.65
-0.65
-0.64
-0.64
-0.64
-0.64
-0.64
-0.63
Expression Profile of Segment S444
Show/Hide
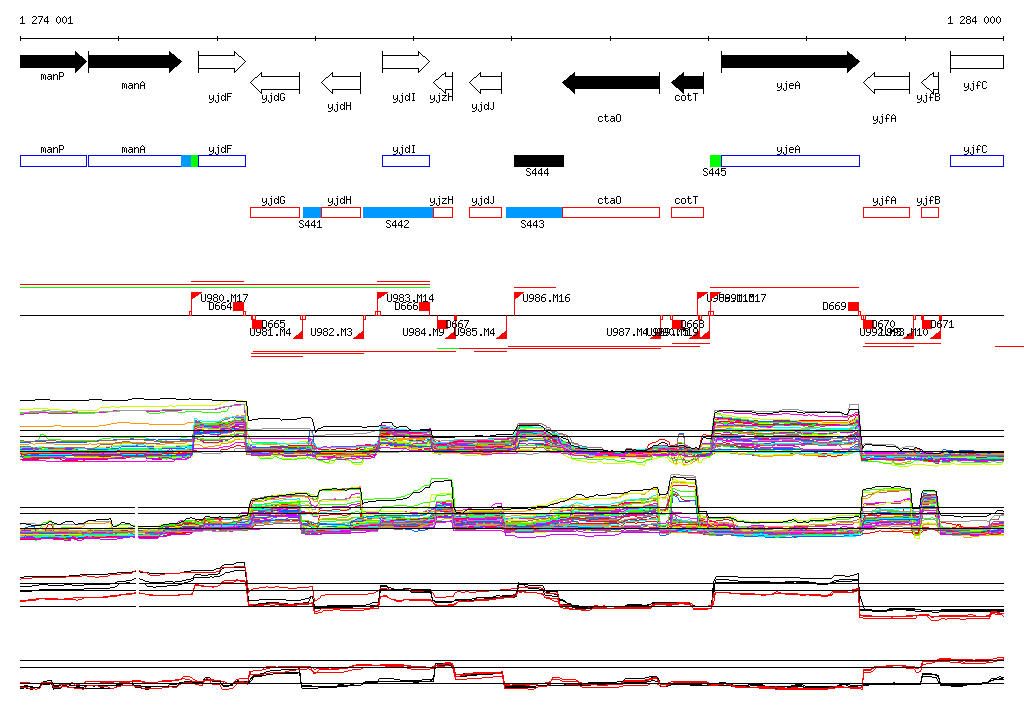
Genomic View of Gene/Segment S444
Show/Hide
(Legend)
Browse Genome Context