| Start Page |
|
 |
| Start Page |
|
|
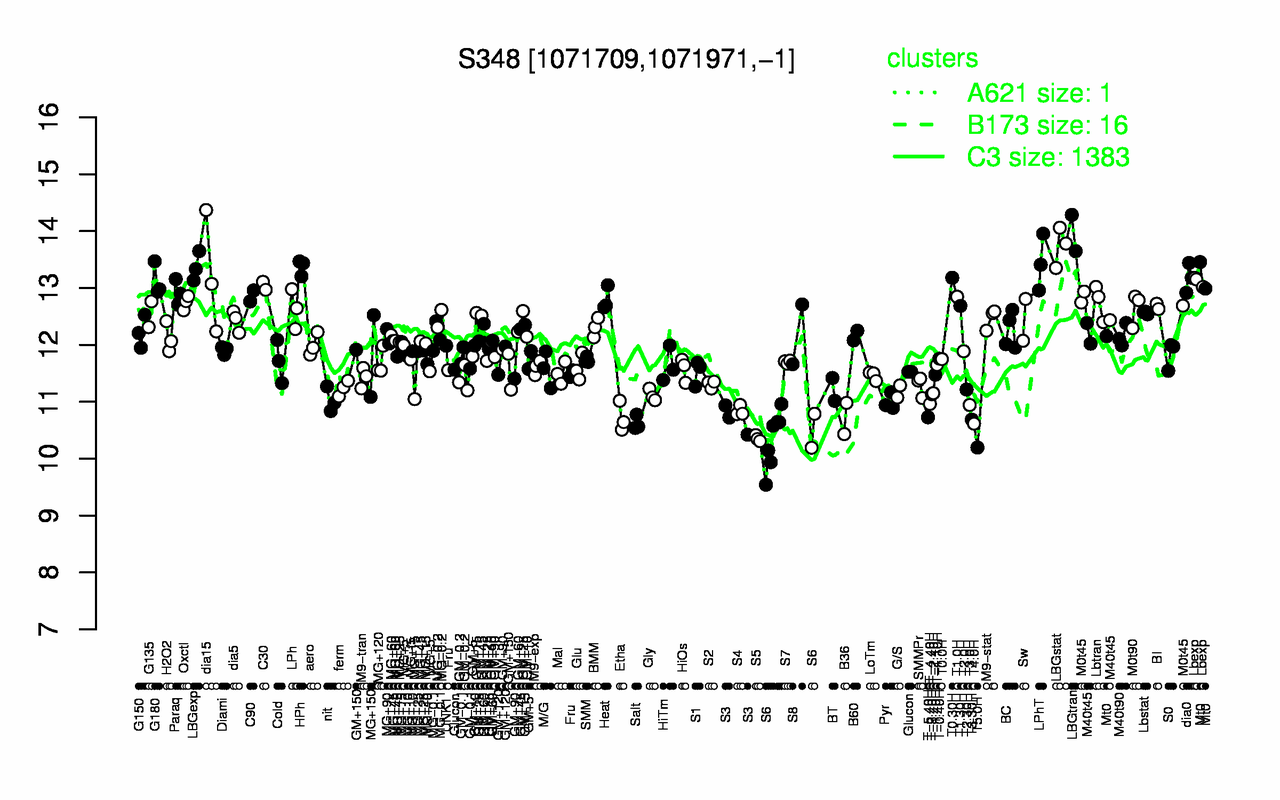
| LBGtran | LBGstat | LPhT | LBGexp | HPh | dia15 | T0.30H | dia0 | G180 | Lbexp |
| 14 | 13.7 | 13.4 | 13.4 | 13.4 | 13.2 | 13.2 | 13.2 | 13.1 | 13.1 |
| T5.0H | S5 | S6 | T4.0H | Salt | T3.30H | S3 | B36 | Etha | T-5.40H |
| 10.2 | 10.4 | 10.4 | 10.6 | 10.6 | 10.7 | 10.7 | 10.7 | 10.7 | 10.7 |