| Start Page |
|
 |
| Start Page |
|
|
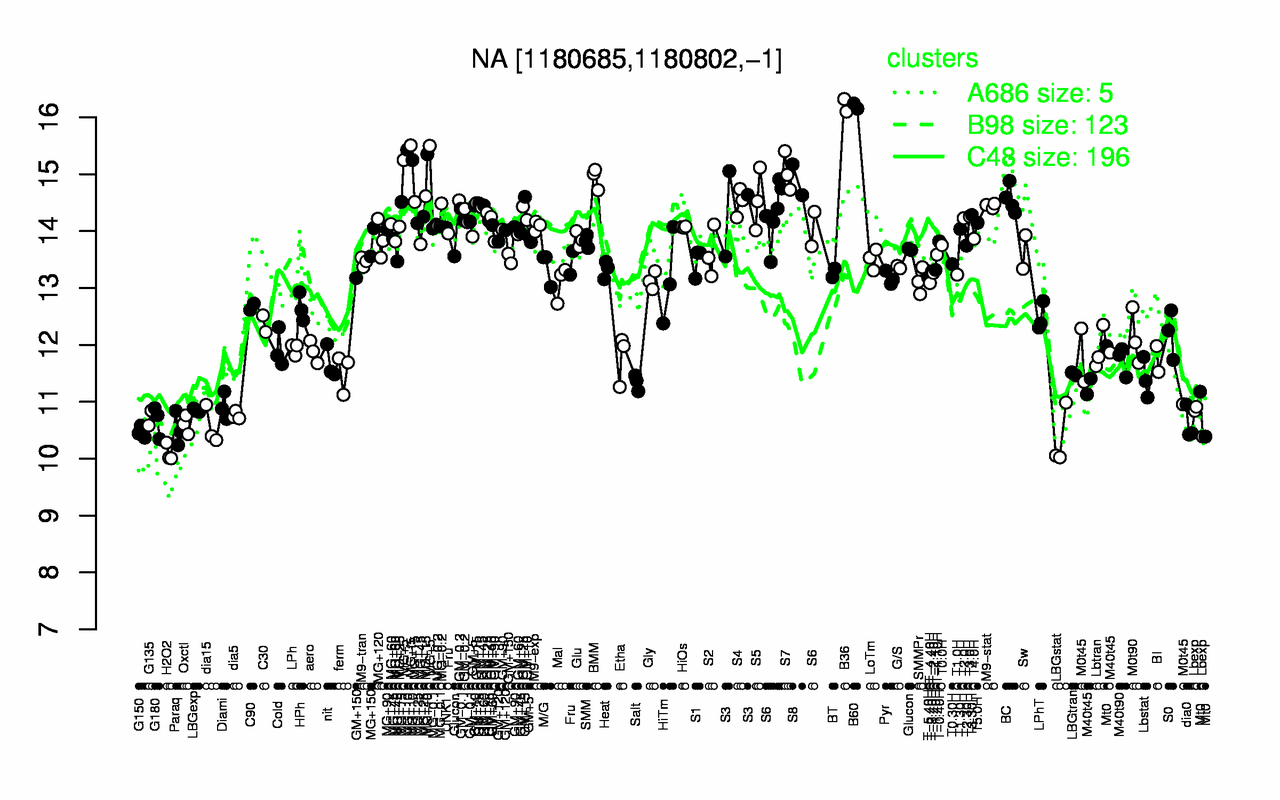
| B36 | B60 | MG+t5 | MG+5 | MG+10 | S7 | BMM | S8 | BC | S5 |
| 16.2 | 16.2 | 15.5 | 15.4 | 15.3 | 15 | 14.9 | 14.9 | 14.6 | 14.6 |
| H2O2 | LBGstat | G150 | Paraq | dia15 | Oxctl | dia0 | G180 | Lbexp | G135 |
| 10.1 | 10.4 | 10.5 | 10.5 | 10.6 | 10.6 | 10.6 | 10.7 | 10.7 | 10.7 |