| Start Page |
|
 |
| Start Page |
|
|
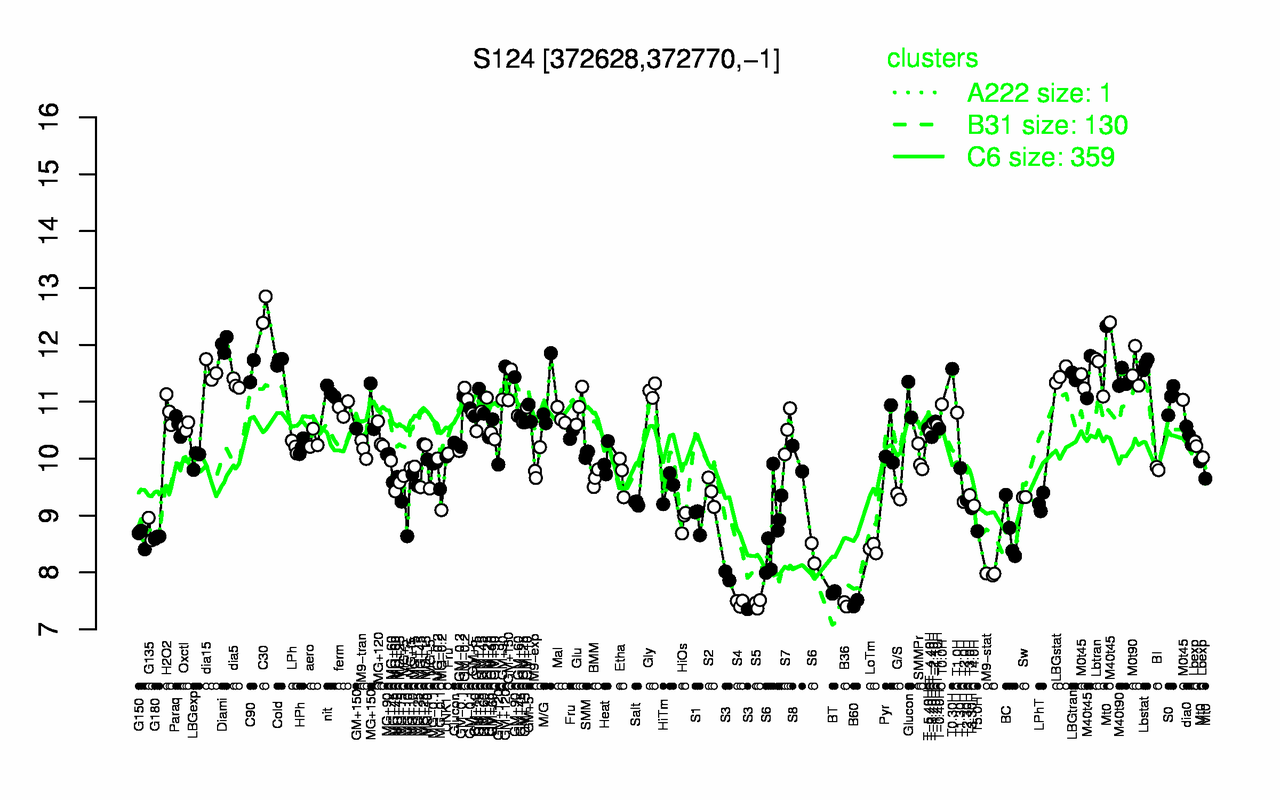
| C30 | Diami | M40t45 | Cold | Lbstat | T0.30H | M0t90 | dia15 | C90 | Lbtran |
| 12.6 | 12 | 11.8 | 11.7 | 11.7 | 11.6 | 11.6 | 11.5 | 11.5 | 11.5 |
| B36 | S5 | B60 | S4 | BT | S3 | M9-stat | LoTm | G150 | G180 |
| 7.44 | 7.45 | 7.46 | 7.47 | 7.65 | 7.74 | 7.97 | 8.42 | 8.61 | 8.62 |