B. subtilis Expression Data Browser
Start Page
B. subtilis Expression Data Browser
Gene/Segment:
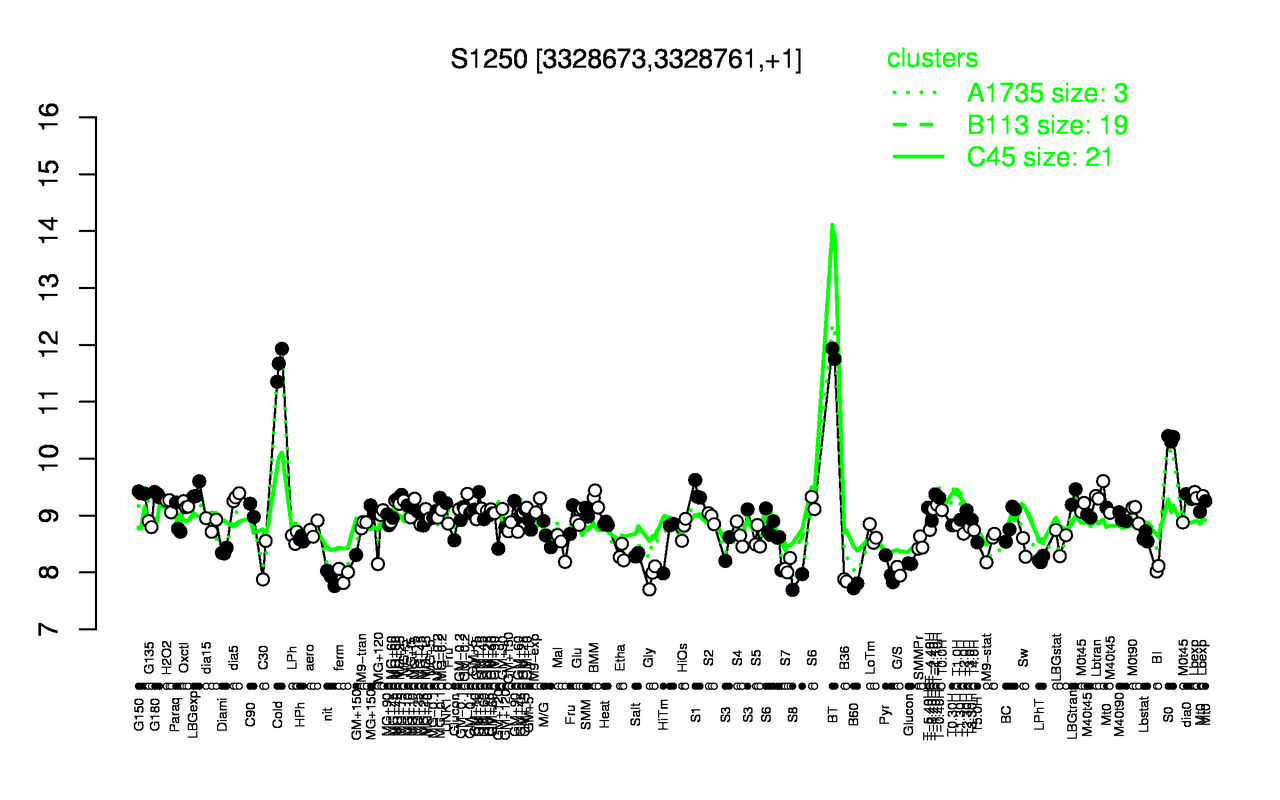
S1250
Locus Tag:
new_3328673_3328761
Details about S1250
Show/Hide
Highest Expression Conditions
BT
Cold
S0
LBGexp
S1
Lbtran
G150
T-1.40H
G180
Lbexp
11.8
11.7
10.4
9.43
9.42
9.42
9.4
9.37
9.37
9.36
Lowest Expression Conditions
B60
S8
B36
nit
Gly
ferm
G/S
Pyr
BI
S7
7.76
7.83
7.86
7.91
7.93
7.96
8.02
8.03
8.07
8.11
Most Positively Correlated Segments
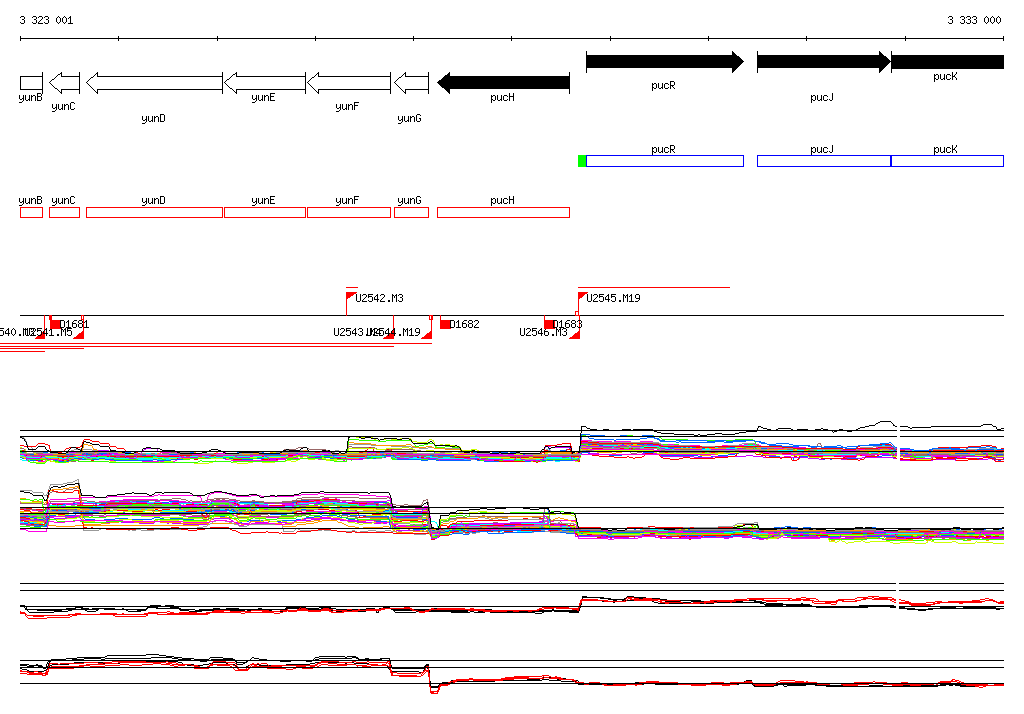
pucR
amtB
pucJ
nasA
pucK
nasB
S625
nasC
yvfS
ywrD
0.89
0.8
0.72
0.67
0.61
0.6
0.6
0.58
0.57
0.55
Most Negatively Correlated Segments
ydaG
ycbP
S145
yuzA
scr
S547
yhcM
S18
yfhD
S17
-0.43
-0.41
-0.4
-0.39
-0.39
-0.37
-0.37
-0.37
-0.37
-0.37
Expression Profile of Segment S1250
Show/Hide
Genomic View of Gene/Segment S1250
Show/Hide
(Legend)
Browse Genome Context