| Start Page |
|
 |
| Start Page |
|
|
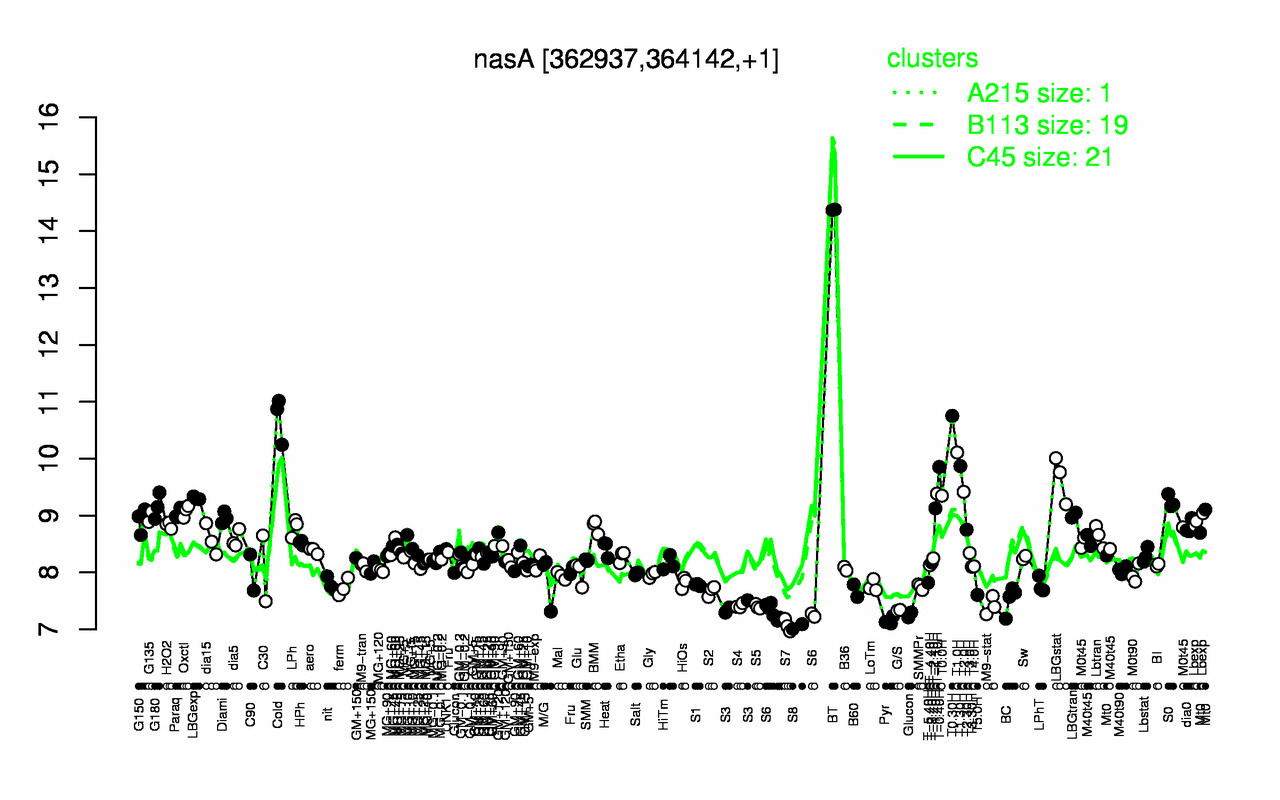
| BT | T0.30H | Cold | T1.0H | T1.30H | T-0.40H | LBGstat | T2.0H | T-1.10H | T0.0H |
| 14.4 | 10.8 | 10.7 | 10.1 | 9.87 | 9.85 | 9.66 | 9.42 | 9.39 | 9.35 |
| S8 | S7 | Pyr | S6 | G/S | S3 | S5 | S4 | M9-stat | Glucon |
| 7.05 | 7.07 | 7.15 | 7.28 | 7.33 | 7.4 | 7.4 | 7.41 | 7.41 | 7.5 |