| Start Page |
|
 |
| Start Page |
|
|
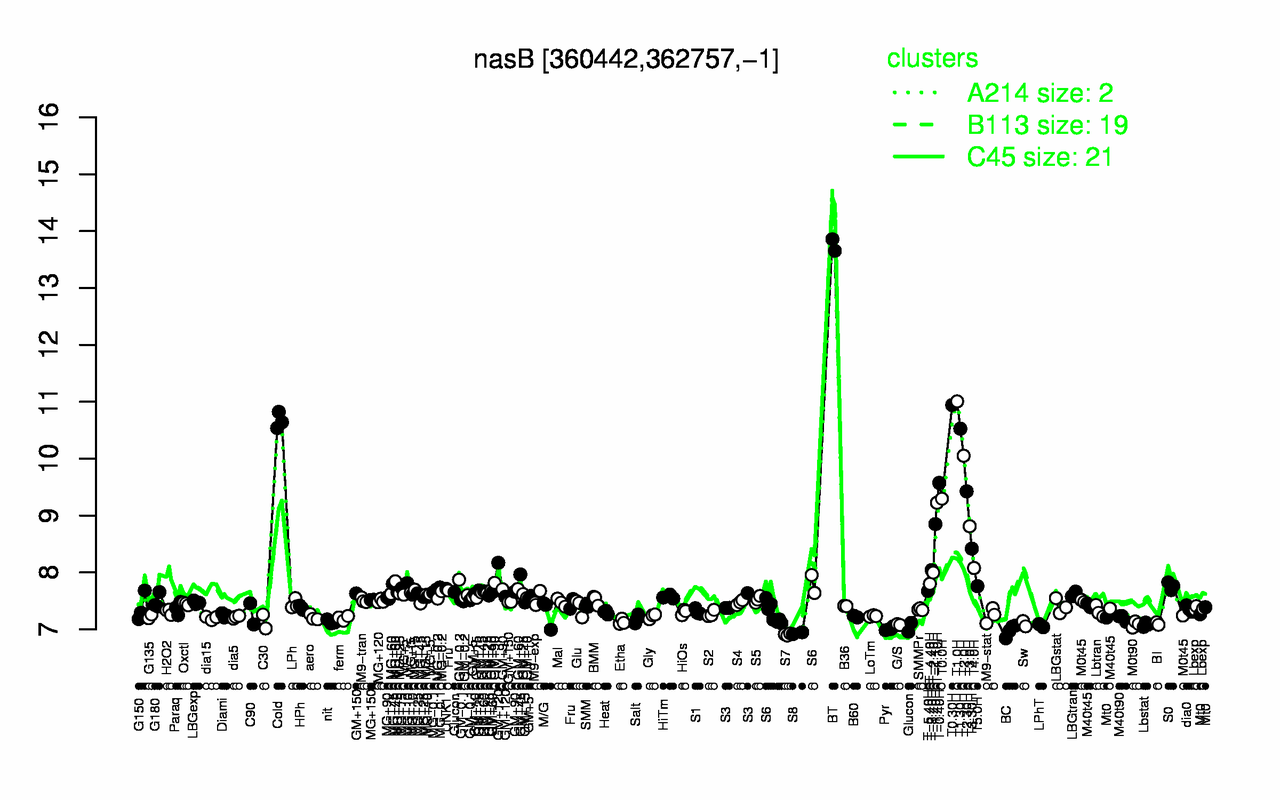
| BT | T1.0H | T0.30H | Cold | T1.30H | T2.0H | T-0.40H | T2.30H | T0.0H | T-1.10H |
| 13.8 | 11 | 10.9 | 10.7 | 10.5 | 10.1 | 9.58 | 9.43 | 9.3 | 9.22 |
| S7 | S8 | BC | Pyr | LPhT | Lbstat | G/S | M0t90 | Sw | BI |
| 6.91 | 6.93 | 6.98 | 7.01 | 7.07 | 7.08 | 7.08 | 7.09 | 7.1 | 7.1 |