| Start Page |
|
 |
| Start Page |
|
|
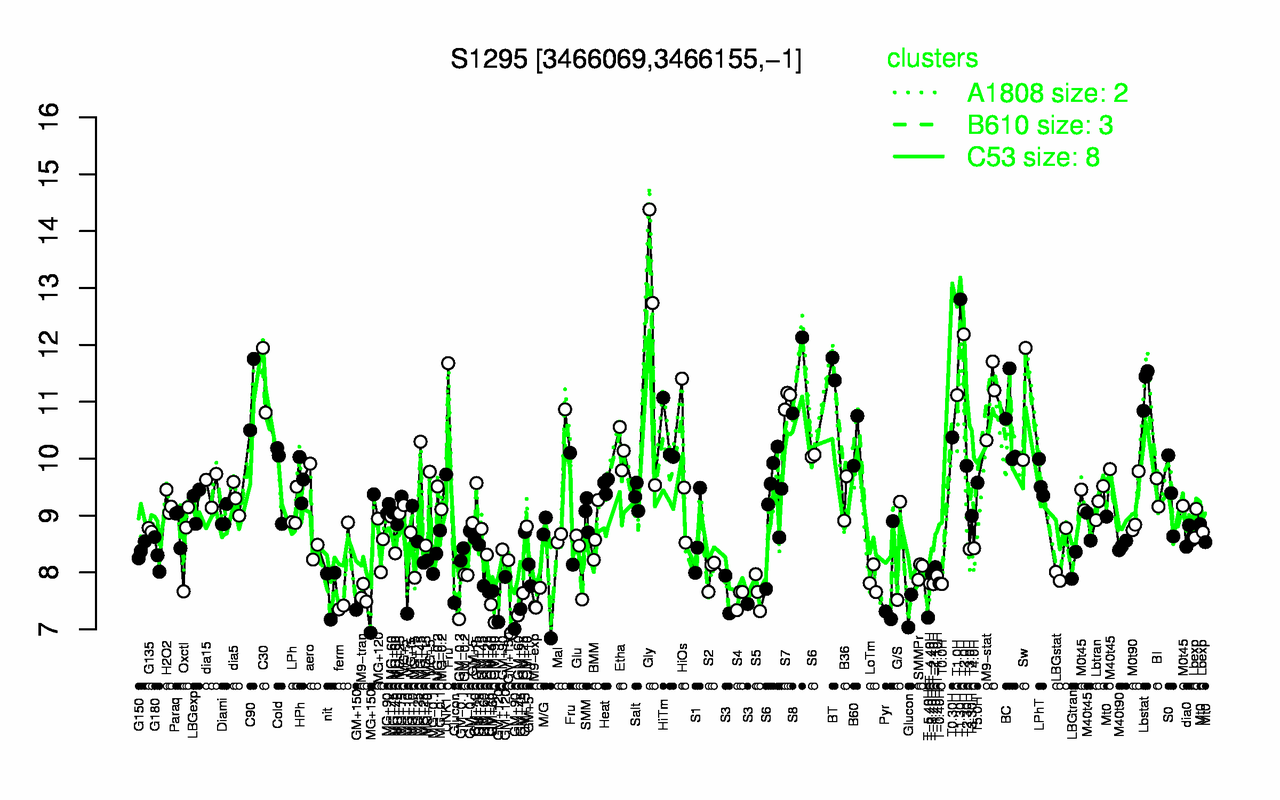
| T1.30H | Gly | T2.0H | BT | S8 | C30 | Lbstat | C90 | T1.0H | M9-stat |
| 12.8 | 12.2 | 12.2 | 11.6 | 11.5 | 11.4 | 11.3 | 11.1 | 11.1 | 11.1 |
| T-5.40H | Glucon | GM+150 | M9-exp | GM+90 | GM+120 | S4 | S3 | GM+60 | M9-tran |
| 7.21 | 7.37 | 7.5 | 7.5 | 7.51 | 7.53 | 7.55 | 7.56 | 7.56 | 7.61 |