| Start Page |
|
 |
| Start Page |
|
|
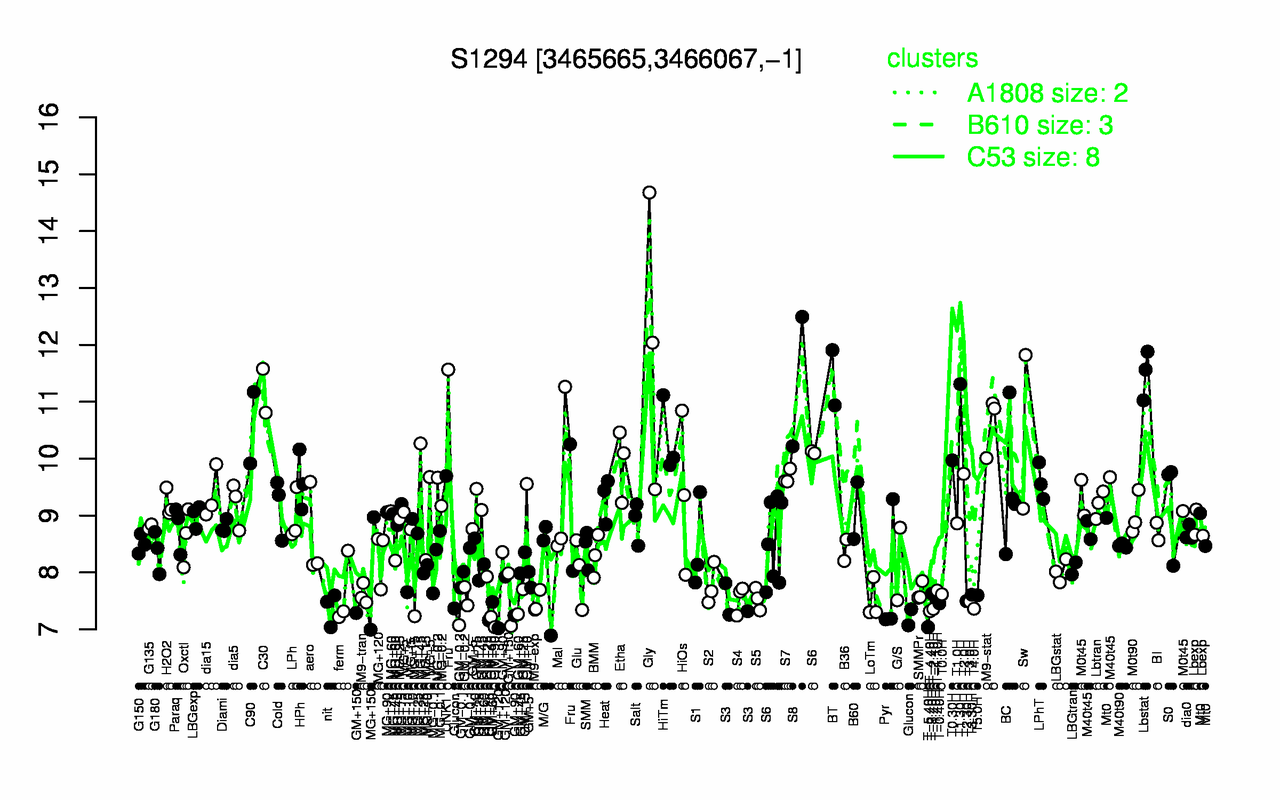
| Gly | Lbstat | BT | S8 | T1.30H | C30 | M9-stat | C90 | Sw | HiTm |
| 12.1 | 11.5 | 11.4 | 11.4 | 11.3 | 11.2 | 10.6 | 10.5 | 10.5 | 10.3 |
| T-5.40H | Glucon | T-4.40H | T-2.40H | T4.0H | nit | GM-0.2 | GM+150 | T-0.40H | S3 |
| 7.04 | 7.26 | 7.32 | 7.36 | 7.36 | 7.37 | 7.41 | 7.44 | 7.45 | 7.46 |