| Start Page |
|
 |
| Start Page |
|
|
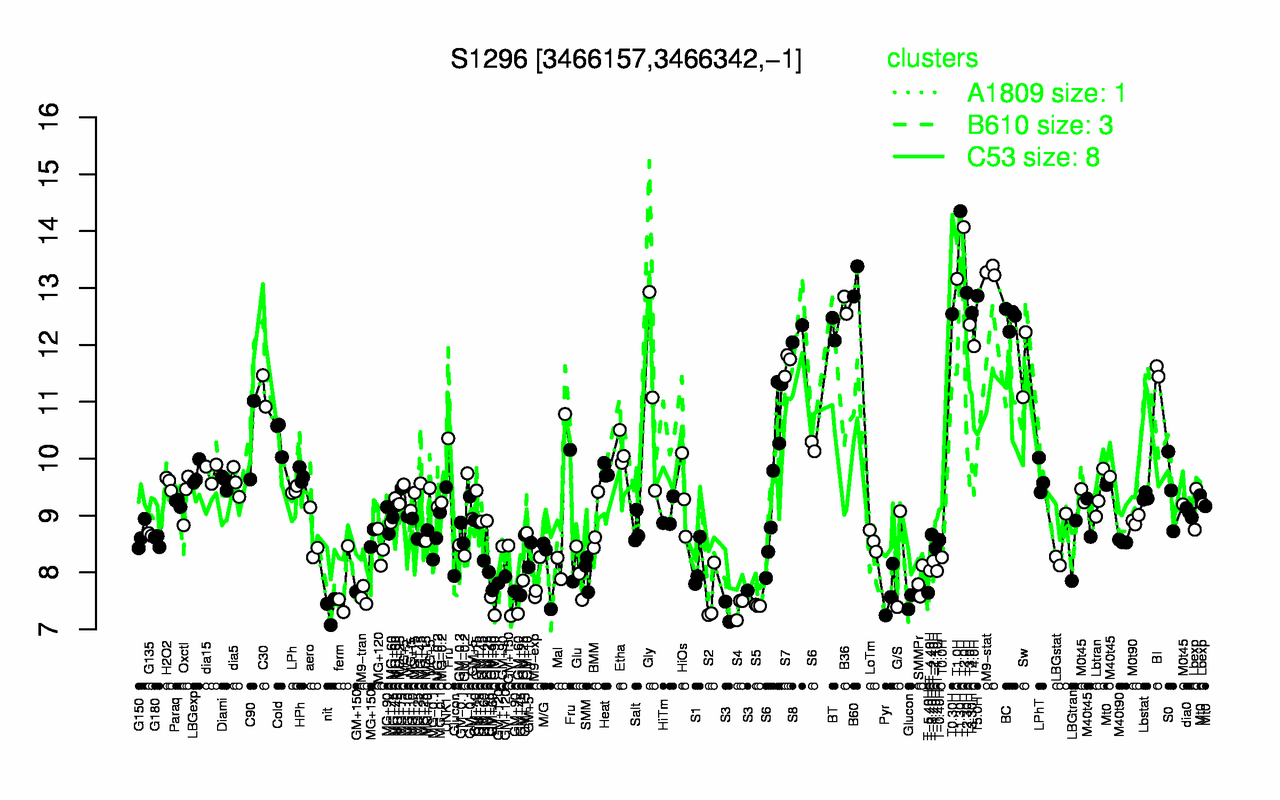
| T1.30H | T2.0H | M9-stat | T1.0H | B60 | T2.30H | T5.0H | B36 | T3.30H | T0.30H |
| 14.3 | 14.1 | 13.3 | 13.2 | 13.1 | 12.9 | 12.9 | 12.7 | 12.6 | 12.5 |
| nit | S4 | S5 | S3 | S2 | M9-tran | Glucon | T-5.40H | Pyr | GM+60 |
| 7.35 | 7.39 | 7.42 | 7.43 | 7.57 | 7.59 | 7.63 | 7.64 | 7.66 | 7.72 |