| Start Page |
|
 |
| Start Page |
|
|
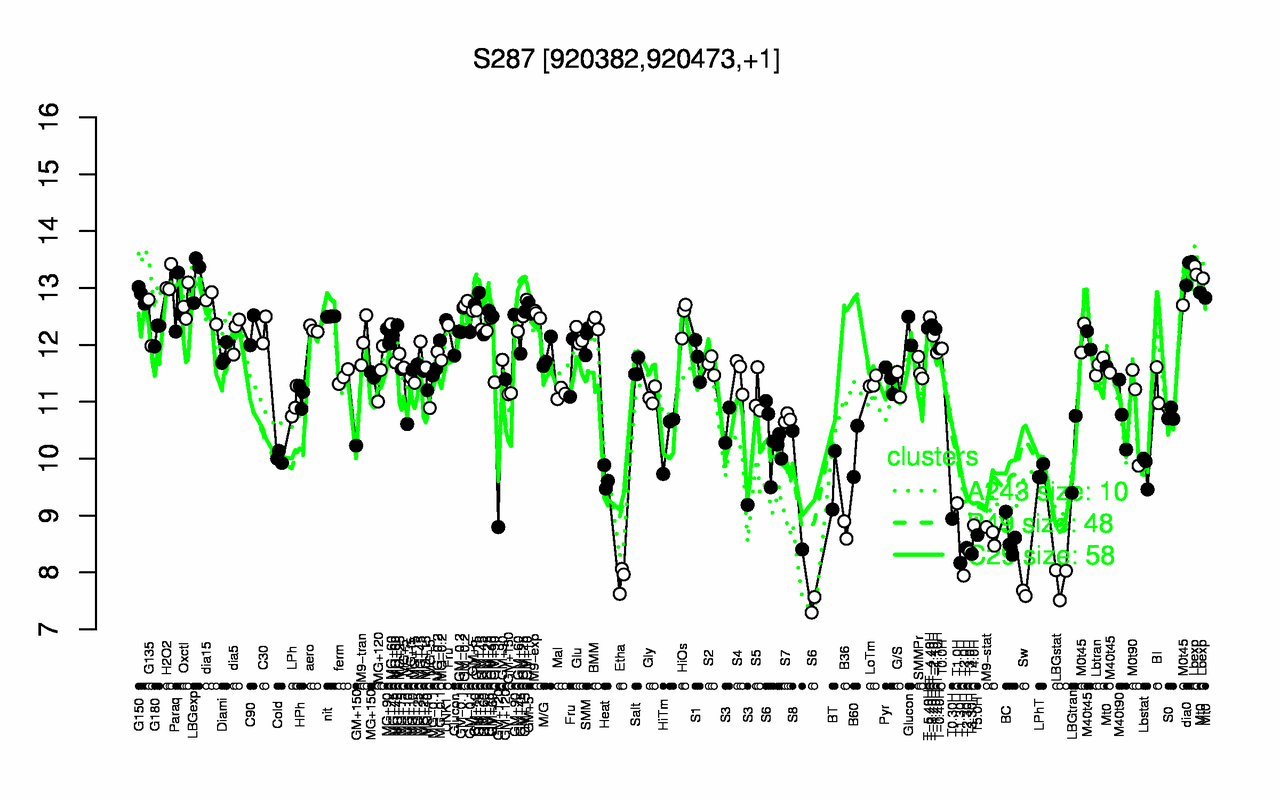
| dia0 | Lbexp | LBGexp | H2O2 | G150 | GM+10 | Oxctl | dia15 | Paraq | GM+5 |
| 13.3 | 13.3 | 13.2 | 13.1 | 12.9 | 12.8 | 12.7 | 12.7 | 12.7 | 12.6 |
| Sw | LBGstat | Etha | T2.0H | T1.30H | T3.30H | T3.0H | T2.30H | BC | M9-stat |
| 7.63 | 7.86 | 7.88 | 7.94 | 8.17 | 8.32 | 8.36 | 8.43 | 8.62 | 8.66 |