| Start Page |
|
 |
| Start Page |
|
|
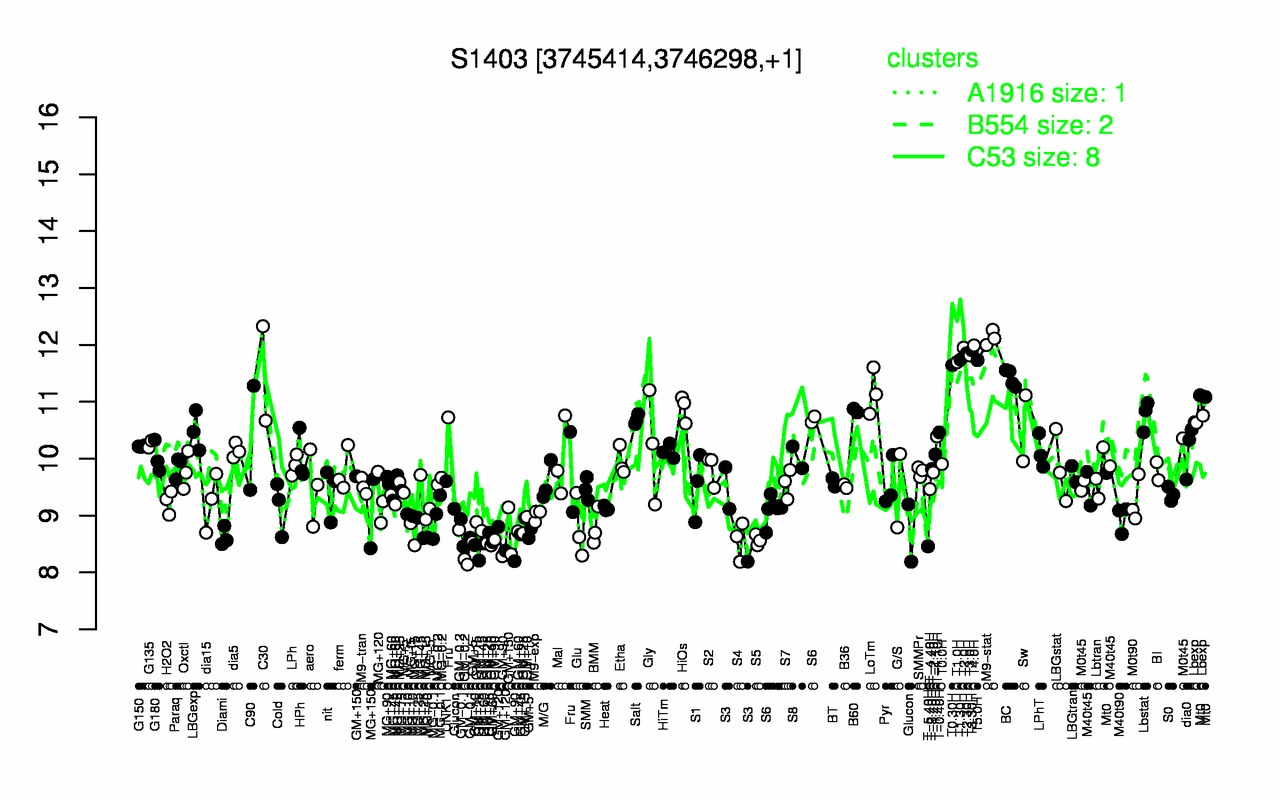
| M9-stat | T4.0H | T2.0H | T3.30H | T2.30H | T3.0H | T1.30H | T5.0H | T1.0H | T0.30H |
| 12.1 | 12 | 12 | 11.9 | 11.9 | 11.8 | 11.7 | 11.7 | 11.7 | 11.6 |
| GM+90 | GM-0.2 | T-5.40H | GM+25 | S4 | S5 | GM+60 | GM+120 | GM+45 | Diami |
| 8.35 | 8.37 | 8.46 | 8.47 | 8.56 | 8.57 | 8.59 | 8.59 | 8.63 | 8.63 |