| Start Page |
|
 |
| Start Page |
|
|
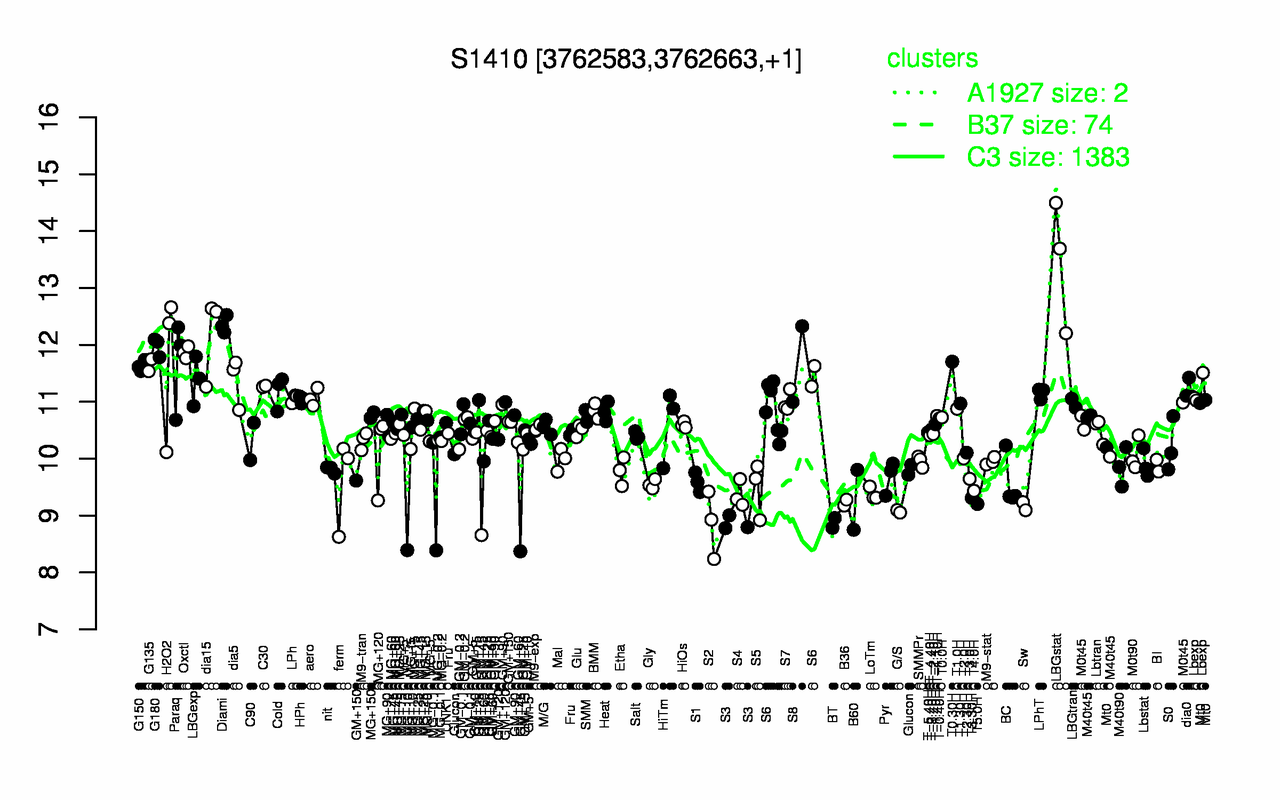
| LBGstat | Diami | dia15 | G180 | Oxctl | H2O2 | T0.30H | S8 | Paraq | G135 |
| 13.5 | 12.4 | 12.2 | 12 | 11.9 | 11.7 | 11.7 | 11.7 | 11.7 | 11.6 |
| S3 | S2 | BT | G/S | GM+45 | Sw | T5.0H | B36 | B60 | T3.30H |
| 8.86 | 8.86 | 8.87 | 9.07 | 9.14 | 9.16 | 9.2 | 9.23 | 9.28 | 9.31 |