B. subtilis Expression Data Browser
Start Page
B. subtilis Expression Data Browser
Gene/Segment:
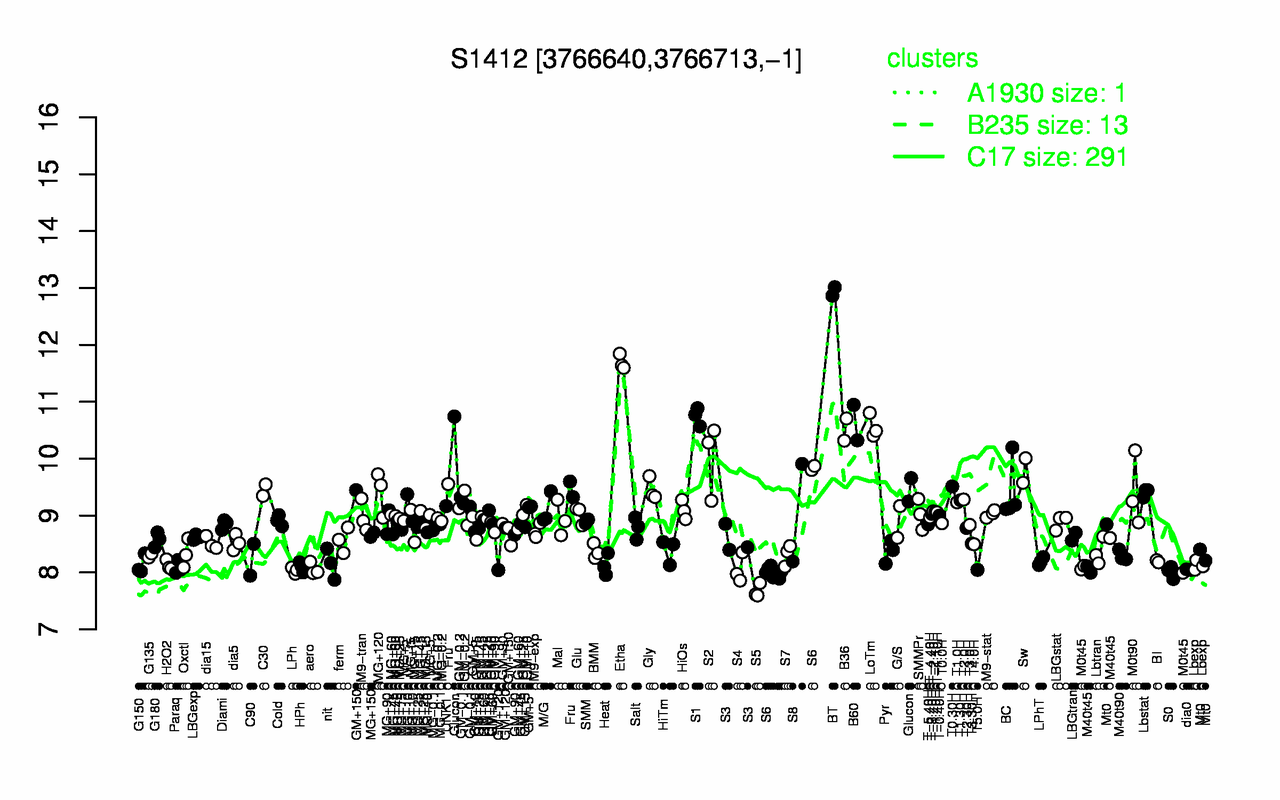
S1412
Locus Tag:
new_3766640_3766713_c
Details about S1412
Show/Hide
Highest Expression Conditions
BT
Etha
S1
B60
LoTm
B36
S2
Glucon
Sw
T0.30H
12.9
11.7
10.7
10.6
10.6
10.5
10
9.88
9.79
9.51
Lowest Expression Conditions
S5
S0
LPh
T5.0H
dia0
M0t45
S4
aero
Paraq
HPh
7.67
8.01
8.04
8.05
8.05
8.05
8.06
8.06
8.09
8.1
Most Positively Correlated Segments
ureC
ureB
ywzE
ureA
S1414
S1415
S1416
ywzF
S1413
yhjB
0.83
0.76
0.72
0.72
0.71
0.71
0.7
0.69
0.68
0.54
Most Negatively Correlated Segments
yxjA
thiI
pbpX
htrC
yvaV
iscS
S606
clsA
deaD
cmk
-0.5
-0.49
-0.48
-0.47
-0.47
-0.47
-0.46
-0.46
-0.45
-0.45
Expression Profile of Segment S1412
Show/Hide
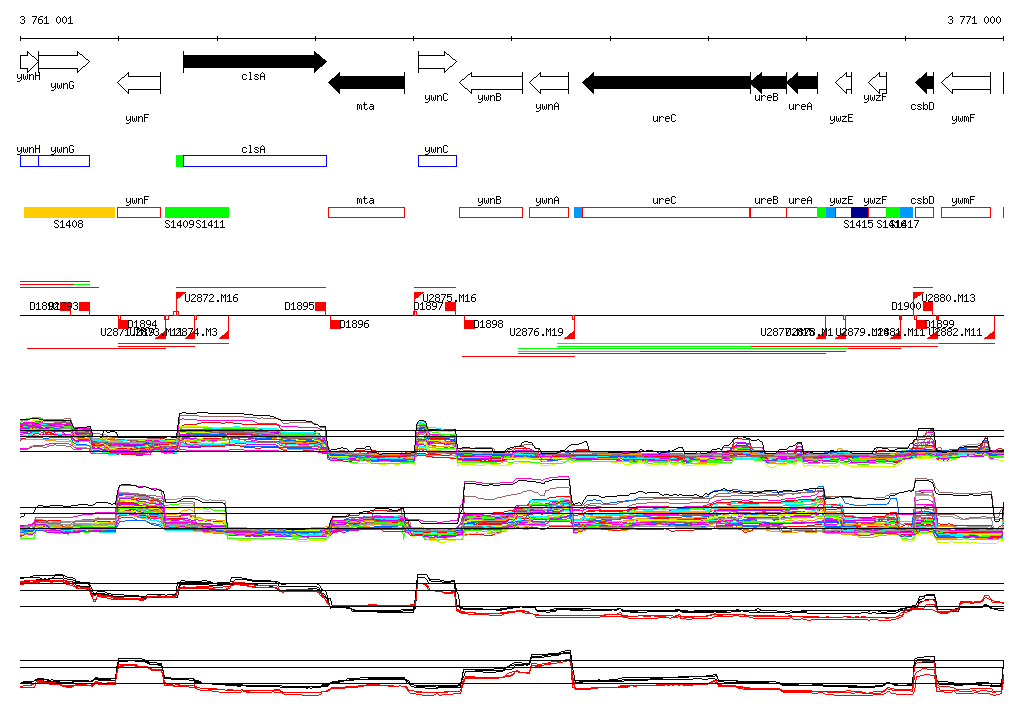
Genomic View of Gene/Segment S1412
Show/Hide
(Legend)
Browse Genome Context