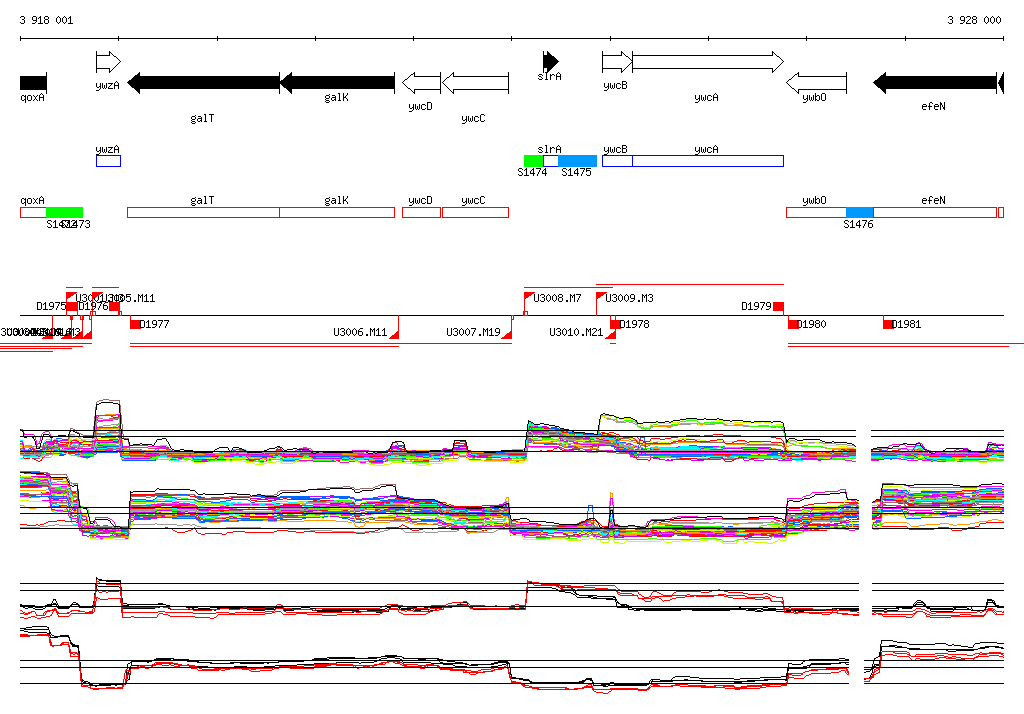
| Start Page |
|
 |
| Start Page |
|
|
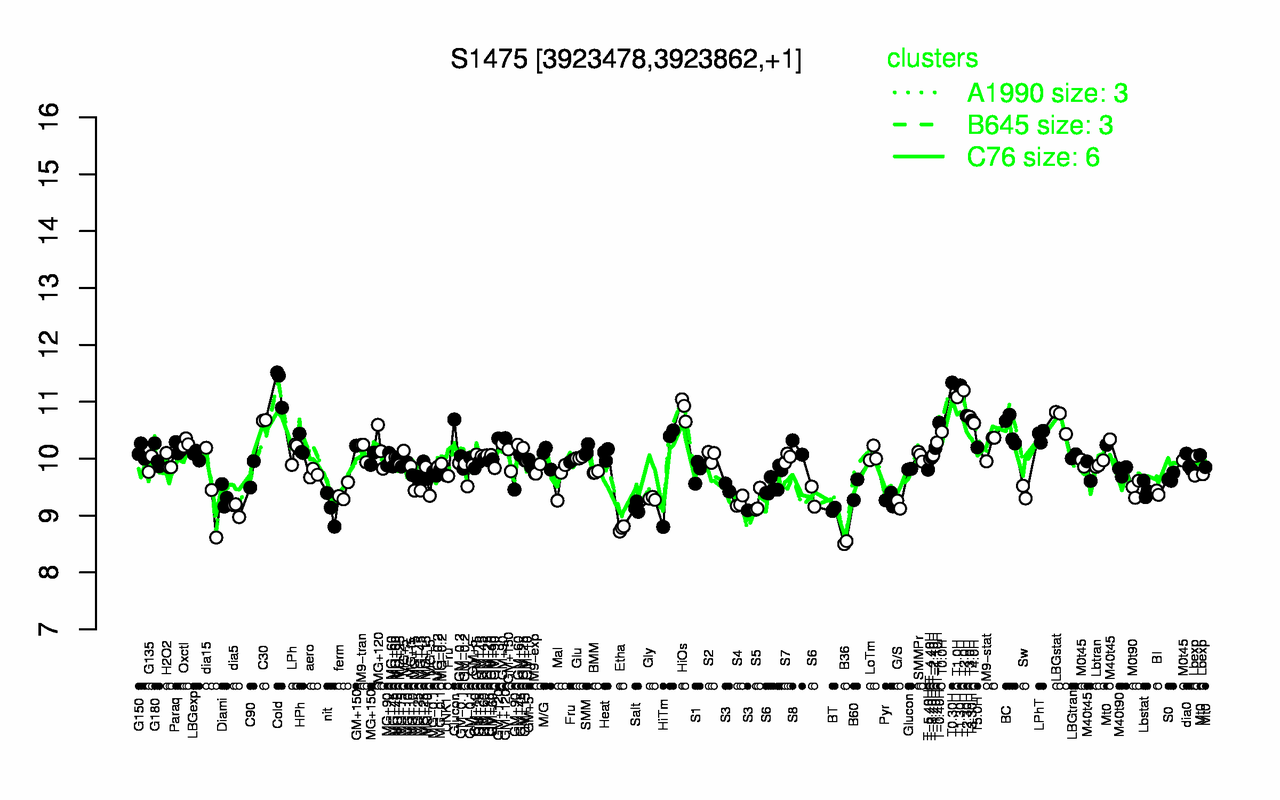
| T0.30H | Cold | T1.30H | T2.0H | T1.0H | HiOs | T2.30H | T3.0H | LBGstat | C30 |
| 11.3 | 11.3 | 11.3 | 11.2 | 11.1 | 10.9 | 10.8 | 10.7 | 10.7 | 10.7 |
| B36 | Etha | BT | nit | dia5 | Salt | G/S | S4 | S5 | Pyr |
| 8.52 | 8.77 | 9.11 | 9.11 | 9.12 | 9.15 | 9.19 | 9.24 | 9.24 | 9.28 |