| Start Page |
|
 |
| Start Page |
|
|
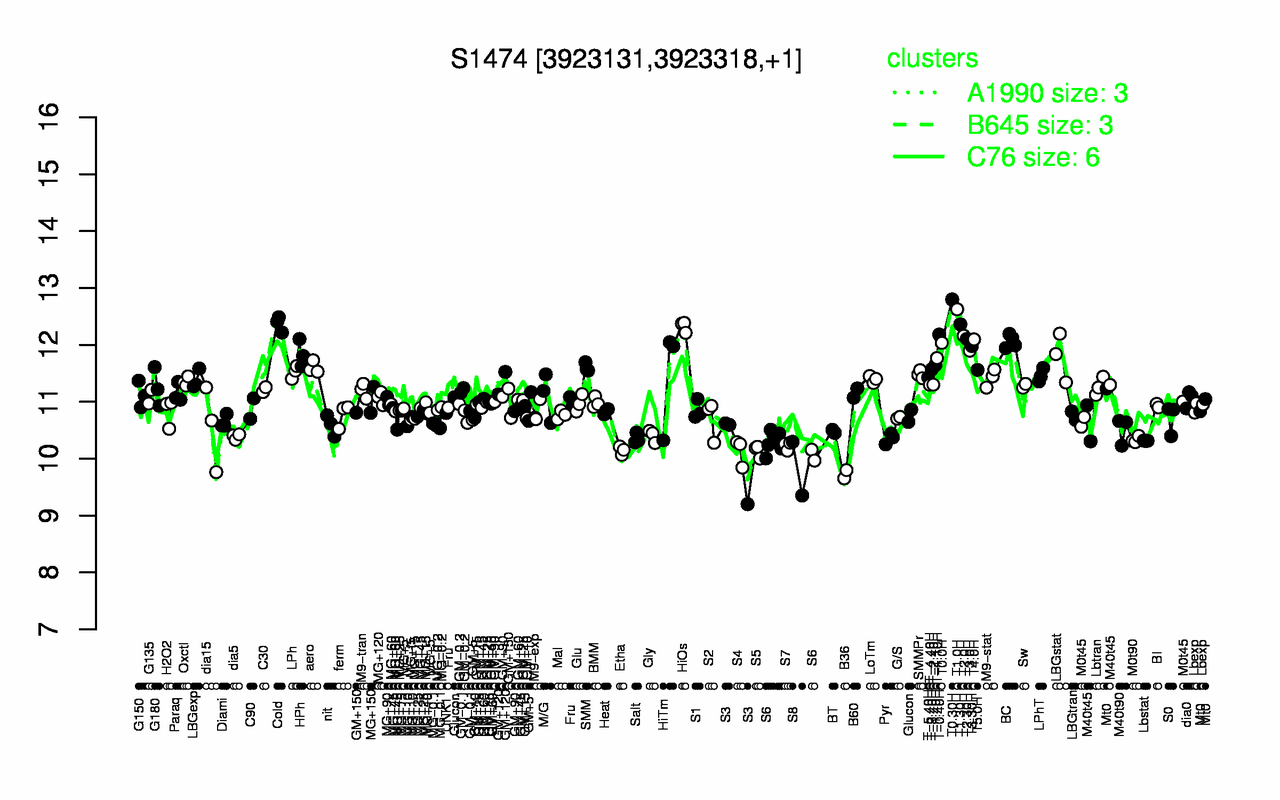
| T0.30H | T1.0H | Cold | T1.30H | HiOs | T-0.40H | T2.0H | T2.30H | T4.0H | BC |
| 12.8 | 12.6 | 12.4 | 12.4 | 12.3 | 12.2 | 12.2 | 12.1 | 12.1 | 12.1 |
| B36 | S8 | S4 | S5 | S3 | Etha | S7 | S6 | Lbstat | M0t90 |
| 9.73 | 9.82 | 10.1 | 10.1 | 10.1 | 10.1 | 10.2 | 10.2 | 10.3 | 10.3 |