| Start Page |
|
 |
| Start Page |
|
|
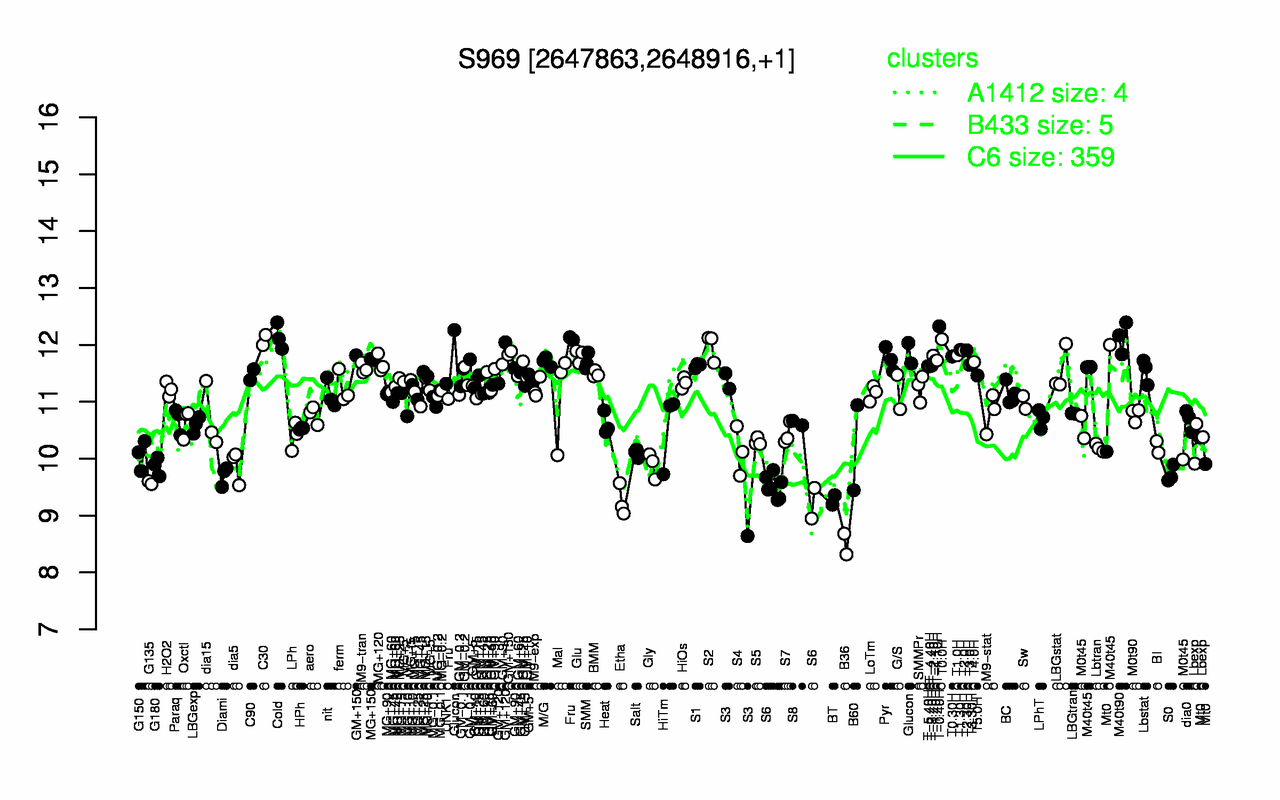
| T-0.40H | Cold | M40t90 | T0.0H | C30 | Glucon | S2 | T1.30H | T2.30H | T2.0H |
| 12.3 | 12.1 | 12.1 | 12.1 | 12.1 | 12 | 12 | 11.9 | 11.9 | 11.9 |
| B36 | Etha | BT | S6 | G135 | Diami | S0 | G180 | dia5 | Gly |
| 8.5 | 9.25 | 9.27 | 9.44 | 9.58 | 9.7 | 9.73 | 9.87 | 9.88 | 9.89 |