| Start Page |
|
 |
| Start Page |
|
|
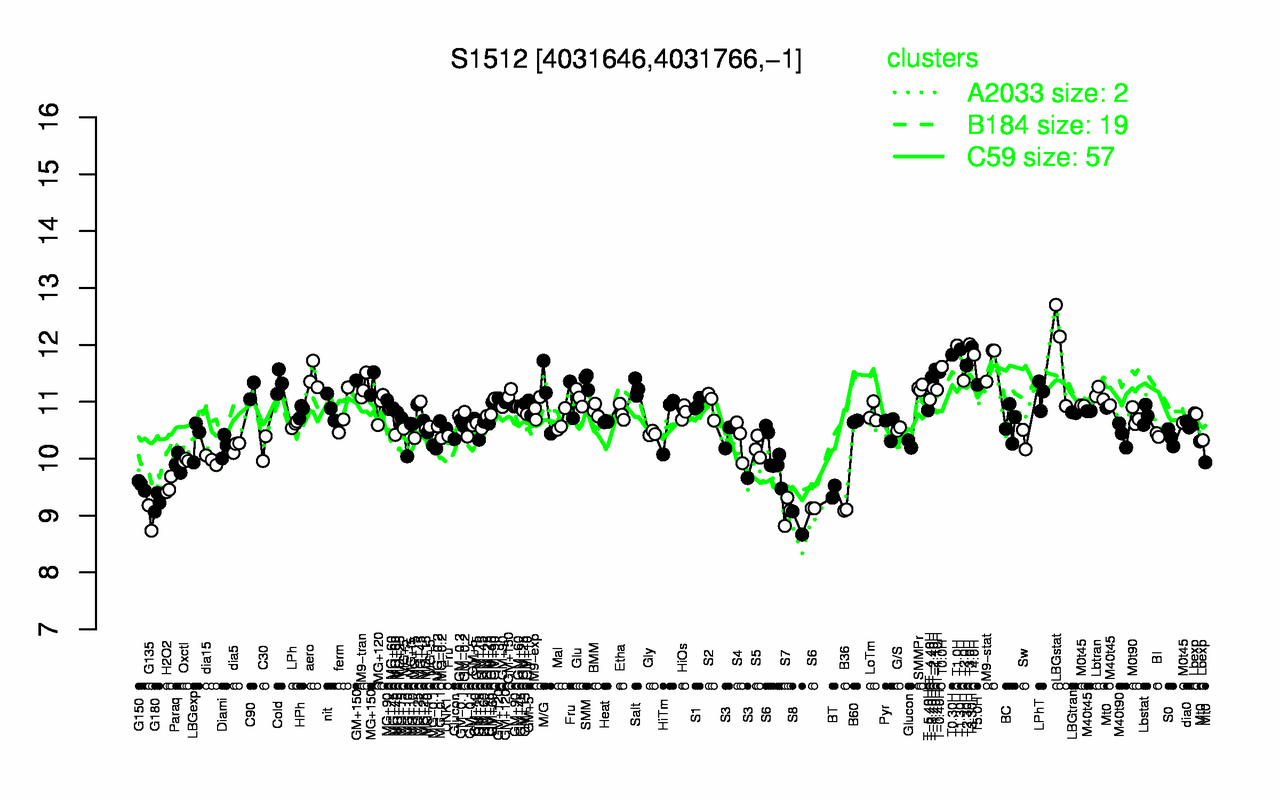
| T3.0H | T1.0H | T3.30H | LBGstat | T1.30H | T0.30H | T4.0H | M9-stat | T2.30H | T0.0H |
| 12 | 12 | 12 | 11.9 | 11.9 | 11.8 | 11.8 | 11.7 | 11.6 | 11.6 |
| S8 | G135 | S7 | B36 | G180 | BT | H2O2 | G150 | S6 | Paraq |
| 8.87 | 8.96 | 9.07 | 9.1 | 9.23 | 9.42 | 9.52 | 9.53 | 9.83 | 9.92 |