| Start Page |
|
 |
| Start Page |
|
|
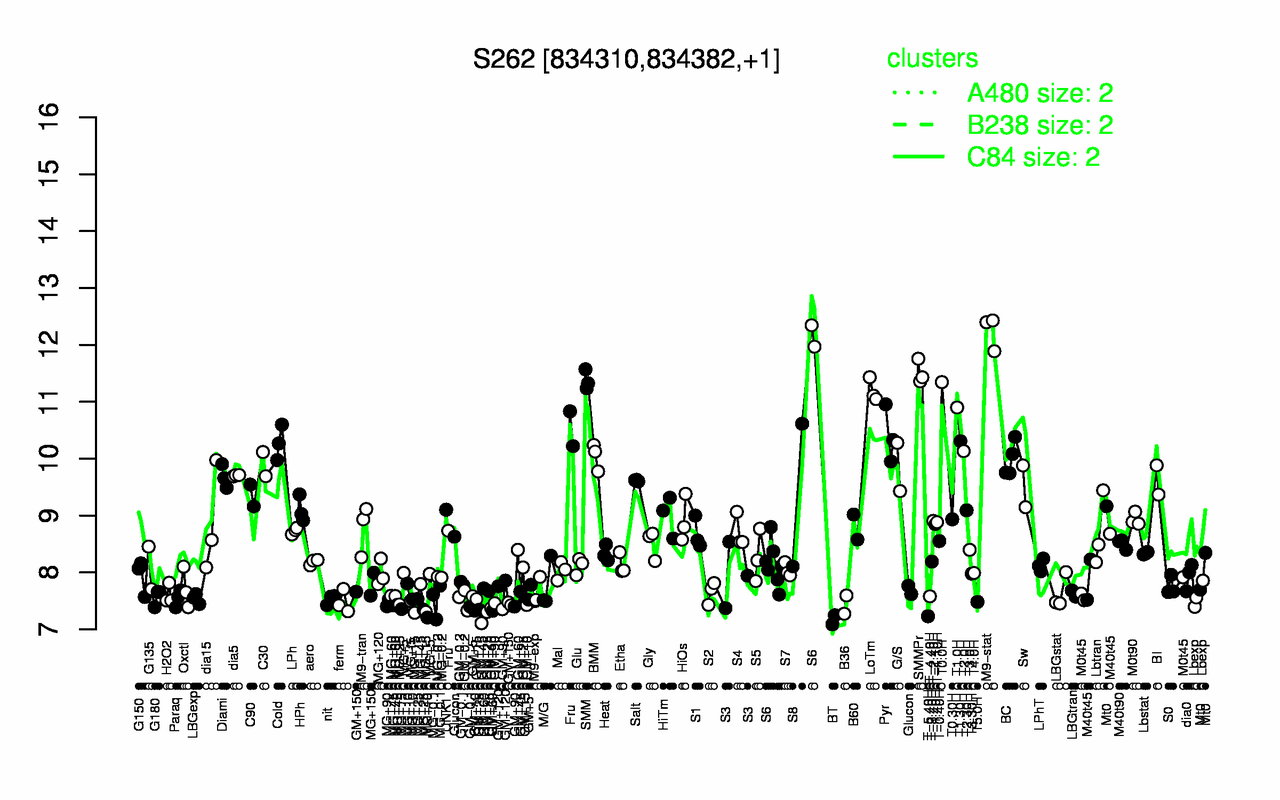
| M9-stat | SMMPr | SMM | T0.0H | LoTm | T1.0H | Pyr | T1.30H | Cold | T2.0H |
| 12.2 | 11.5 | 11.4 | 11.3 | 11.2 | 10.9 | 10.4 | 10.3 | 10.3 | 10.1 |
| BT | T-5.40H | MG+15 | GM+10 | GM+45 | GM+90 | B36 | MG+25 | MG+90 | T5.0H |
| 7.17 | 7.23 | 7.32 | 7.38 | 7.38 | 7.4 | 7.43 | 7.44 | 7.47 | 7.48 |