B. subtilis Expression Data Browser
Start Page
B. subtilis Expression Data Browser
Gene/Segment:
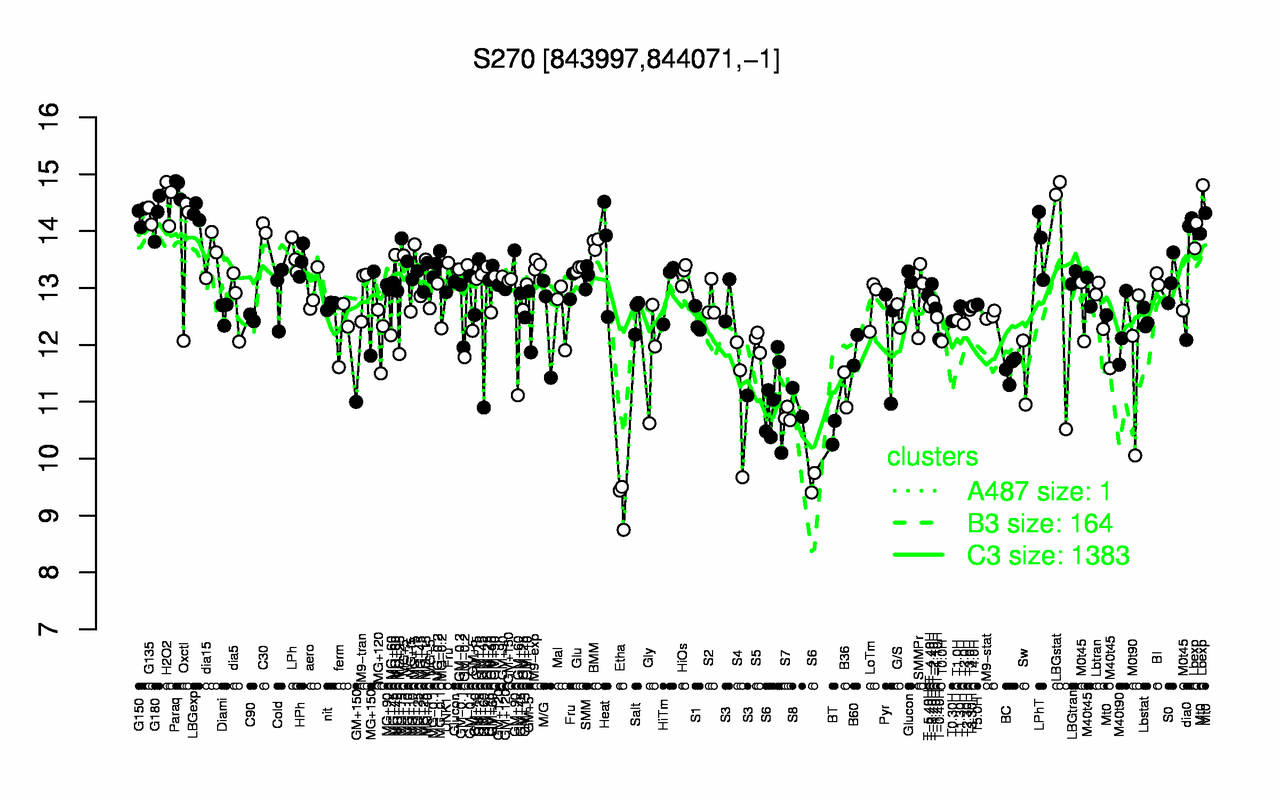
S270
Locus Tag:
new_843997_844071_c
Details about S270
Show/Hide
Highest Expression Conditions
Paraq
H2O2
LBGexp
G150
G135
G180
Lbexp
C30
LPhT
BMM
14.8
14.5
14.3
14.3
14.3
14.3
14.2
14.1
13.8
13.8
Lowest Expression Conditions
Etha
BT
S6
S7
S8
S4
B36
Sw
BC
M0t90
9.23
10.5
10.7
10.8
11
11.1
11.2
11.5
11.6
11.7
Most Positively Correlated Segments
yflE
cdsA
dusC
S621
S280
yufK
tagG
S1166
S281
ylbH
0.79
0.77
0.77
0.76
0.76
0.75
0.75
0.75
0.74
0.74
Most Negatively Correlated Segments
ymzB
phrI
S750
yhzD
yjaZ
mpr
S1136
yccK
phrG
S1223
-0.71
-0.67
-0.64
-0.63
-0.62
-0.62
-0.61
-0.61
-0.61
-0.6
Expression Profile of Segment S270
Show/Hide
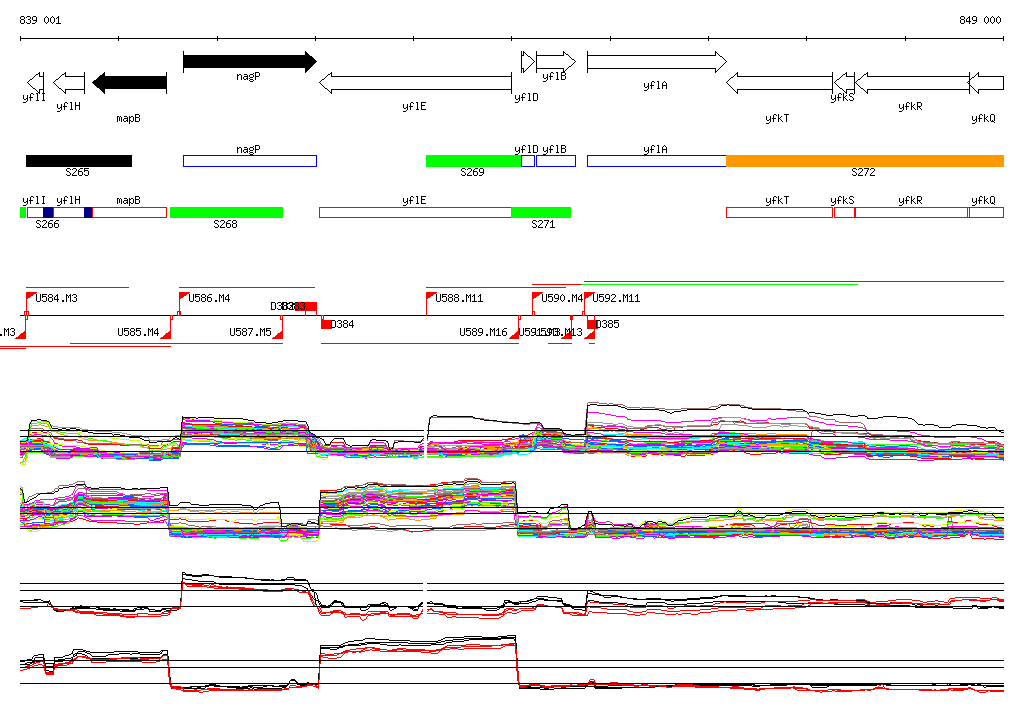
Genomic View of Gene/Segment S270
Show/Hide
(Legend)
Browse Genome Context