B. subtilis Expression Data Browser
Details about S27 Show/Hide
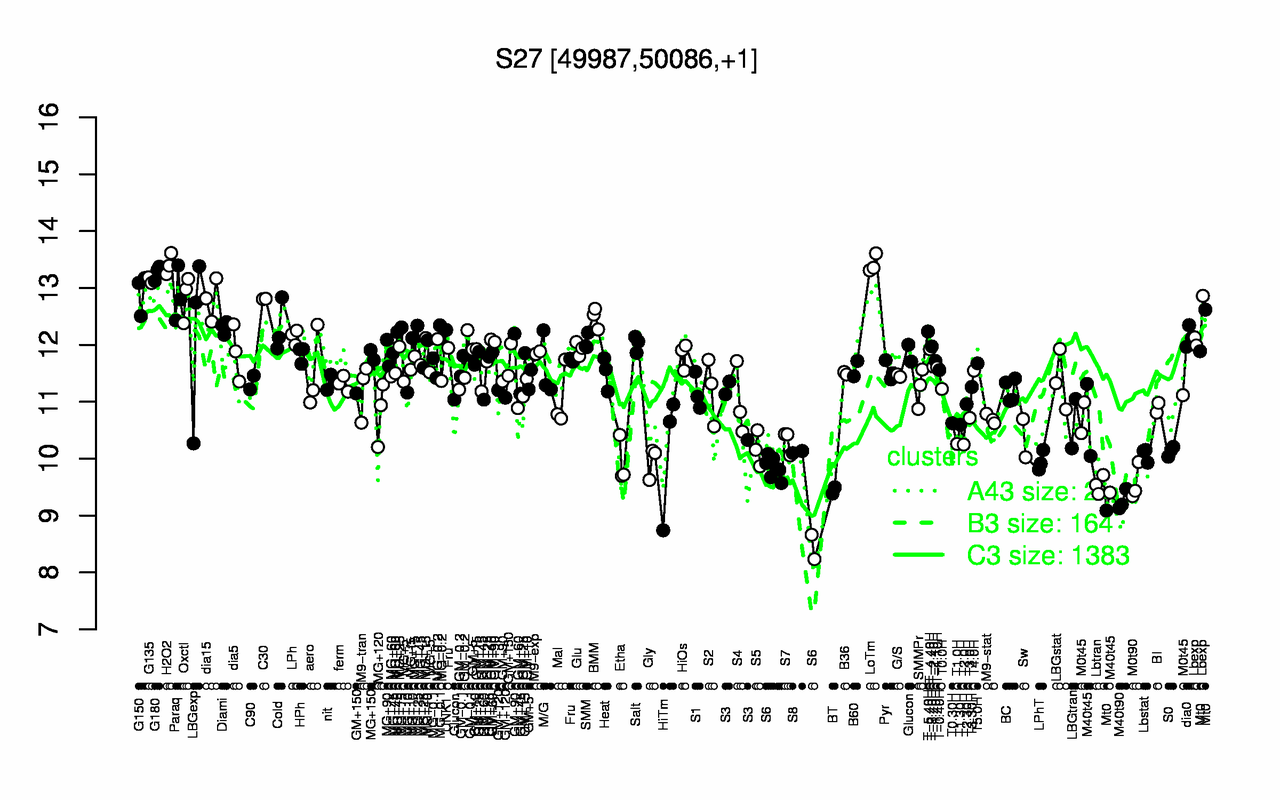
Highest Expression Conditions
LoTm H2O2 G180 G135 G150 Paraq Oxctl C30 dia15 BMM
13.4 13.4 13.3 13.1 12.9 12.9 12.8 12.8 12.8 12.5
Lowest Expression Conditions
M40t90 BT S6 Lbtran M0t90 Etha Gly LPhT Lbstat HiTm
9.26 9.44 9.53 9.54 9.57 9.94 9.95 9.96 10.1 10.1
Most Positively Correlated Segments
S48 S51 rnmV nusG S593 yccF S1089 ylxS S1142 S280
0.86 0.82 0.82 0.81 0.8 0.79 0.79 0.78 0.78 0.78
Most Negatively Correlated Segments
yqaC yccK yukJ dacC yisT phrG yugM phy msmE yugN
-0.75 -0.71 -0.69 -0.69 -0.69 -0.68 -0.67 -0.67 -0.67 -0.66
Expression Profile of Segment S27 Show/Hide
Genomic View of Gene/Segment S27 Show/Hide
(Legend)