| Start Page |
|
 |
| Start Page |
|
|
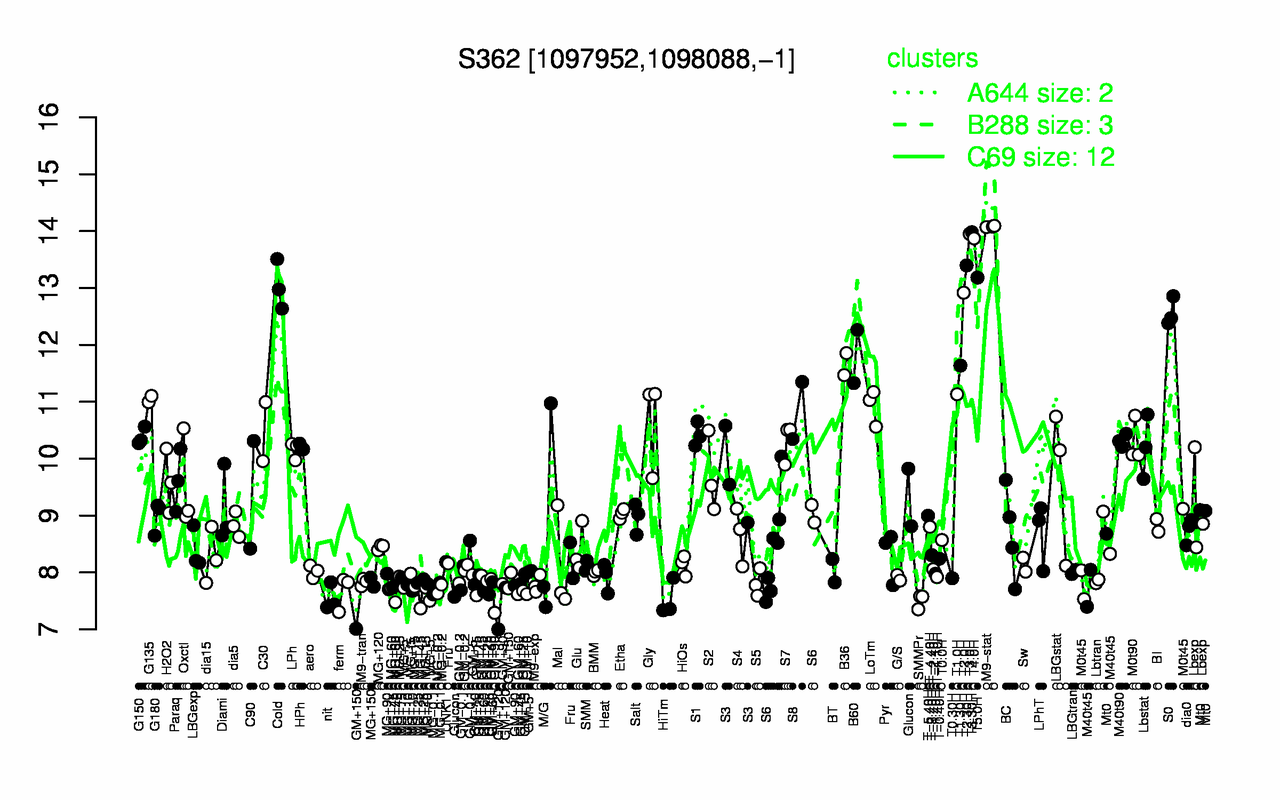
| M9-stat | T3.30H | T3.0H | T4.0H | T2.30H | T5.0H | Cold | T2.0H | S0 | B60 |
| 14.1 | 14 | 14 | 13.9 | 13.4 | 13.2 | 13 | 12.9 | 12.6 | 11.8 |
| GM+120 | SMMPr | HiTm | nit | GM+150 | MG+60 | MG+5 | GM+90 | MG+45 | ferm |
| 7.37 | 7.5 | 7.53 | 7.55 | 7.58 | 7.6 | 7.62 | 7.62 | 7.65 | 7.67 |