| Start Page |
|
 |
| Start Page |
|
|
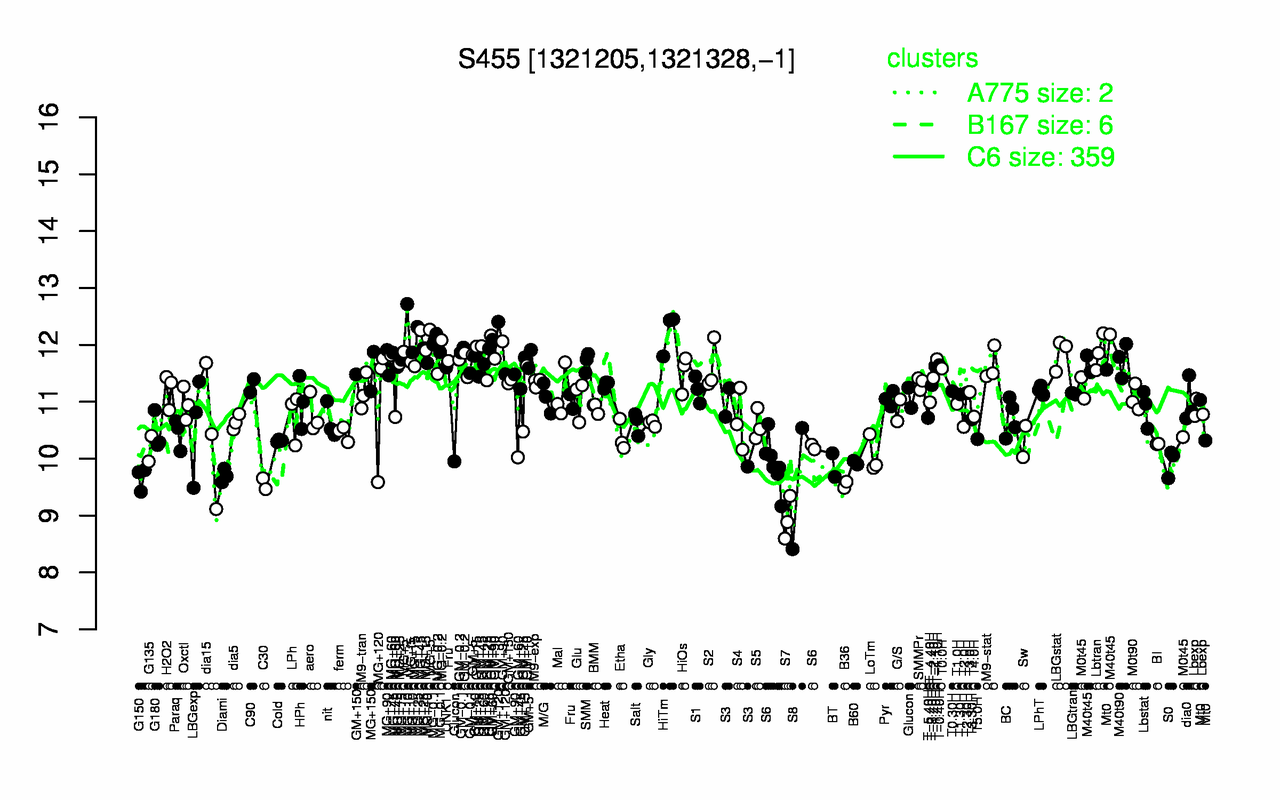
| HiTm | MG+10 | MG+5 | MG-0.1 | MG+25 | GM+120 | MG+45 | GM+15 | Lbtran | LBGstat |
| 12.2 | 12.1 | 12.1 | 12 | 12 | 11.9 | 11.9 | 11.9 | 11.9 | 11.8 |
| S7 | S8 | B36 | C30 | G150 | Diami | BT | B60 | S0 | S6 |
| 8.94 | 9.47 | 9.54 | 9.56 | 9.66 | 9.7 | 9.89 | 9.93 | 9.94 | 9.97 |