| Start Page |
|
 |
| Start Page |
|
|
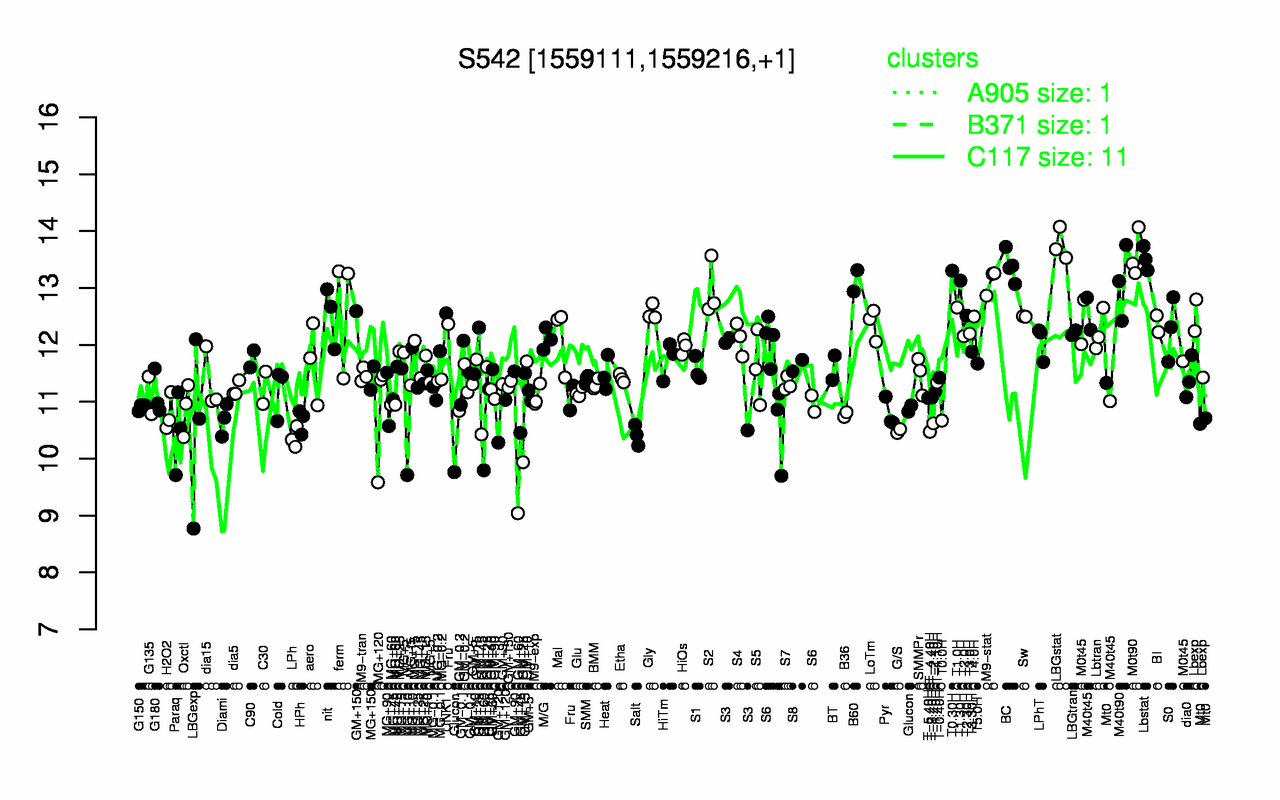
| LBGstat | M0t90 | Lbstat | BC | T0.30H | T1.30H | B60 | M9-stat | M40t90 | S2 |
| 13.8 | 13.6 | 13.5 | 13.4 | 13.3 | 13.1 | 13.1 | 13.1 | 13.1 | 13 |
| GM+60 | LPh | Salt | Paraq | T-4.40H | G/S | Glucon | LBGexp | T-2.40H | GM+120 |
| 10.1 | 10.4 | 10.4 | 10.5 | 10.5 | 10.5 | 10.5 | 10.5 | 10.6 | 10.7 |