B. subtilis Expression Data Browser
Start Page
B. subtilis Expression Data Browser
Gene/Segment:
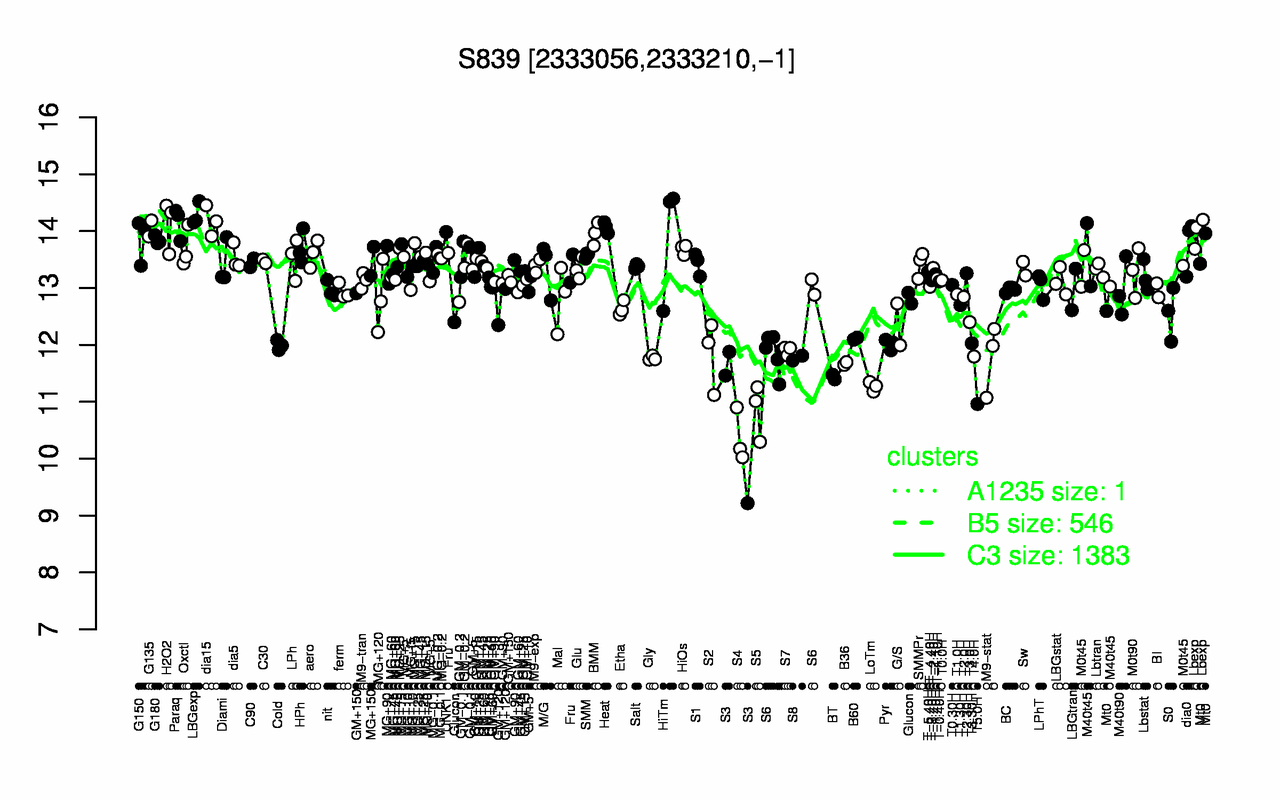
S839
Locus Tag:
new_2333056_2333210_c
Details about S839
Show/Hide
Highest Expression Conditions
LBGexp
dia15
Paraq
H2O2
Heat
G135
UNK1
Lbexp
BMM
HiTm
14.3
14.2
14.2
14.1
14.1
14
14
14
14
13.9
Lowest Expression Conditions
S4
S3
S5
T5.0H
LoTm
BT
B36
Gly
S8
M9-stat
10.4
10.9
10.9
11
11.3
11.4
11.7
11.8
11.8
11.8
Most Positively Correlated Segments
S1131
S1130
ypsA
ywdF
S219
ydjB
ycgR
S621
yfhQ
yxjN
0.78
0.78
0.77
0.76
0.76
0.76
0.76
0.75
0.75
0.75
Most Negatively Correlated Segments
sinI
S924
spoIIAB
rsfA
sigF
spoIIIAH
spoIIIAG
glgD
S1246
spoIIIAF
-0.79
-0.79
-0.78
-0.78
-0.78
-0.77
-0.77
-0.76
-0.76
-0.76
Expression Profile of Segment S839
Show/Hide
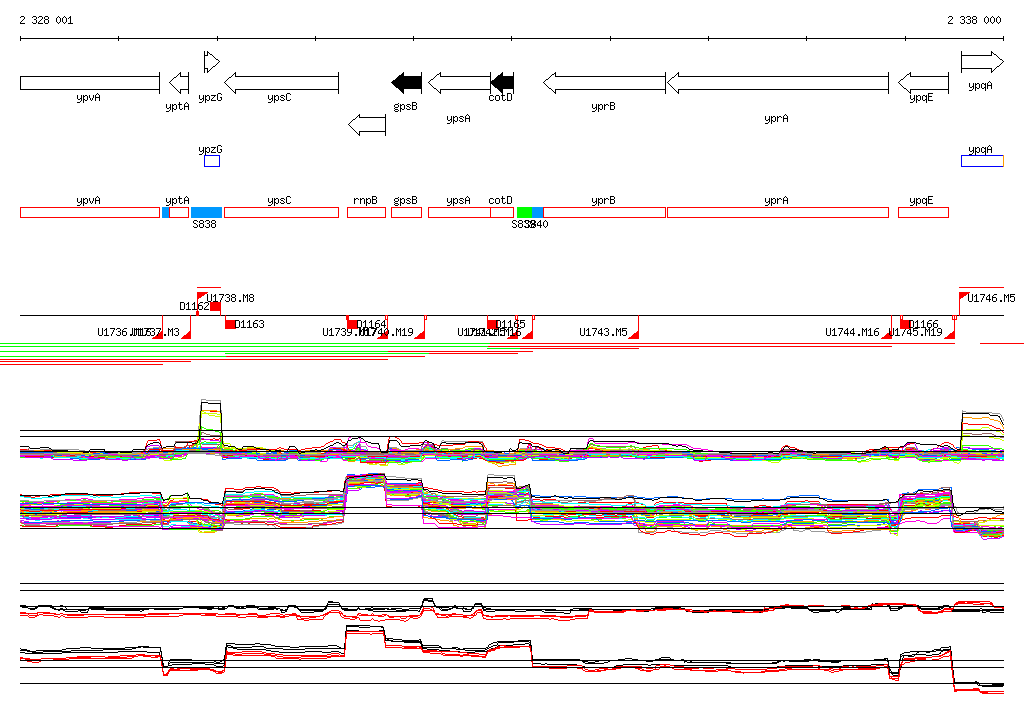
Genomic View of Gene/Segment S839
Show/Hide
(Legend)
Browse Genome Context