| Start Page |
|
 |
| Start Page |
|
|
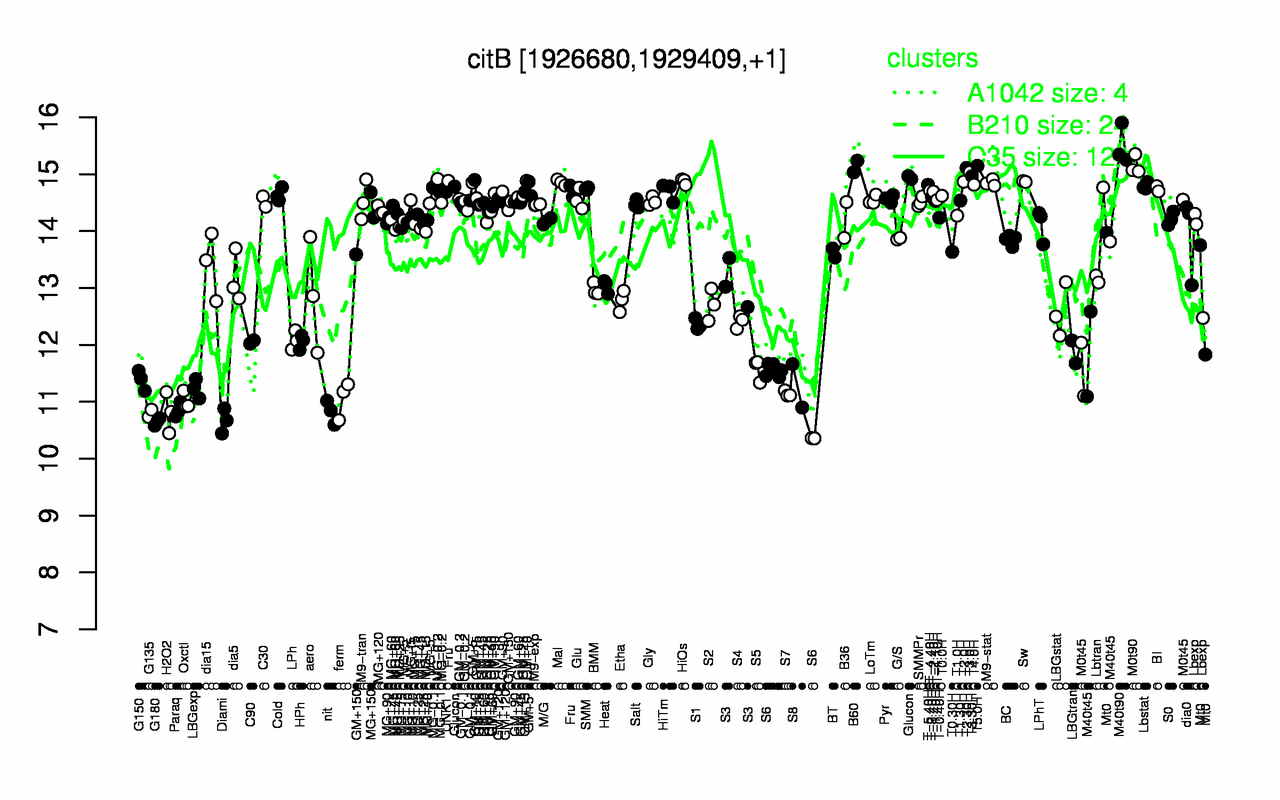
| M40t90 | M0t90 | T5.0H | B60 | T2.30H | T3.0H | T3.30H | GM+10 | Glucon | HiOs |
| 15.5 | 15.2 | 15.1 | 15.1 | 15.1 | 15 | 15 | 14.9 | 14.9 | 14.9 |
| G180 | Diami | G135 | H2O2 | nit | Paraq | Oxctl | ferm | S7 | LBGexp |
| 10.7 | 10.7 | 10.8 | 10.8 | 10.8 | 10.9 | 11 | 11.1 | 11.1 | 11.2 |