| Start Page |
|
 |
| Start Page |
|
|
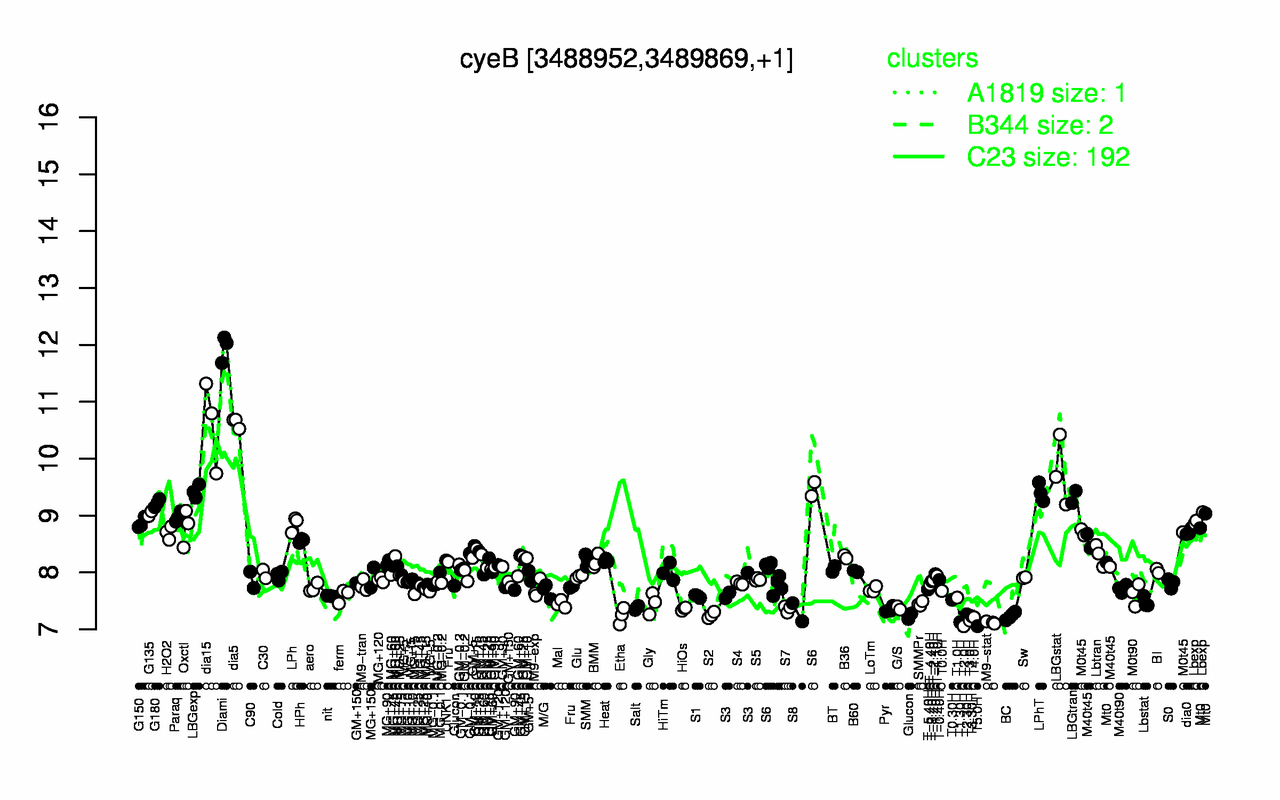
| Diami | dia5 | dia15 | LBGstat | LBGexp | LPhT | LBGtran | G180 | G135 | Paraq |
| 11.9 | 10.6 | 10.6 | 9.77 | 9.43 | 9.41 | 9.33 | 9.22 | 9.03 | 8.98 |
| T2.0H | T5.0H | M9-stat | T1.30H | T3.0H | T4.0H | T3.30H | BC | Etha | S2 |
| 7.06 | 7.06 | 7.12 | 7.12 | 7.15 | 7.21 | 7.23 | 7.23 | 7.24 | 7.25 |