| Start Page |
|
 |
| Start Page |
|
|
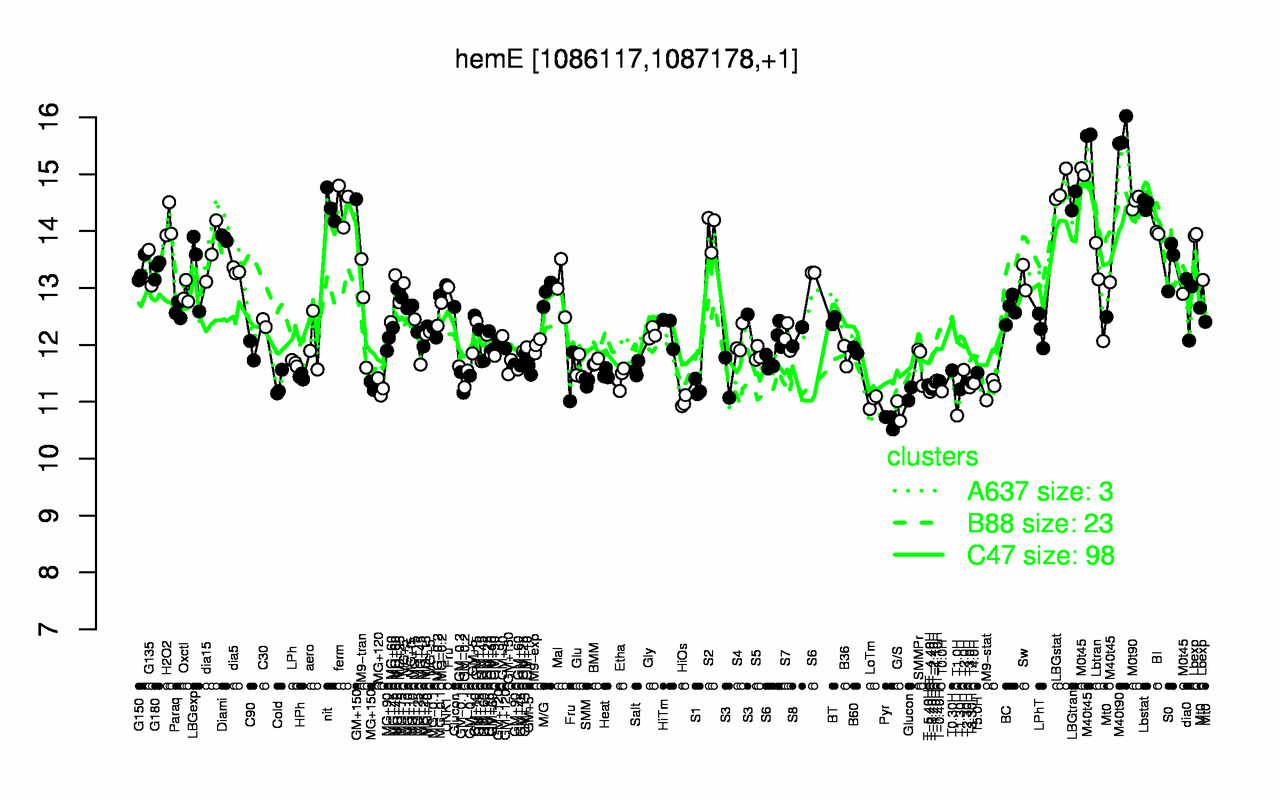
| M40t90 | M40t45 | LBGstat | LBGtran | M0t90 | ferm | Lbstat | nit | M0t45 | H2O2 |
| 15.7 | 14.8 | 14.8 | 14.5 | 14.5 | 14.5 | 14.5 | 14.4 | 14.3 | 14.1 |
| Pyr | T1.0H | G/S | HiOs | LoTm | T-4.40H | T0.0H | T1.30H | T-3.40H | M9-stat |
| 10.7 | 10.8 | 10.8 | 11 | 11 | 11.2 | 11.2 | 11.2 | 11.2 | 11.2 |