B. subtilis Expression Data Browser
Start Page
B. subtilis Expression Data Browser
Gene/Segment:
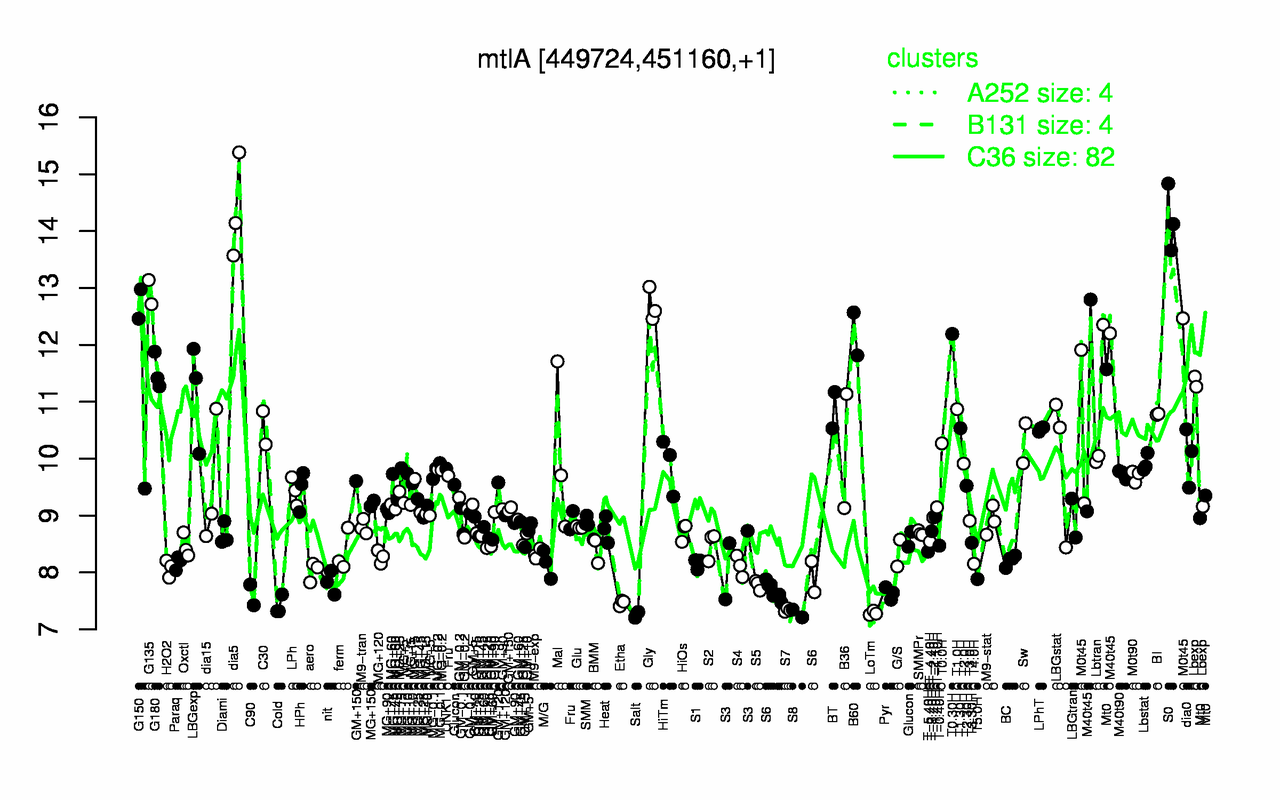
mtlA
Locus Tag:
BSU03981
Details about mtlA
Show/Hide
Highest Expression Conditions
dia5
S0
G135
Gly
B60
T0.30H
G150
G180
M40t45
M0t45
14.4
14.2
12.9
12.7
12.2
12.2
11.6
11.5
11.4
11.2
Lowest Expression Conditions
Salt
S8
LoTm
S7
Cold
Etha
C90
Pyr
S6
S5
7.26
7.28
7.29
7.34
7.42
7.46
7.6
7.63
7.73
7.78
Most Positively Correlated Segments
S132
mtlF
mtlD
mleA
gmuA
S892
lctP
mleN
gmuB
yrhD
0.98
0.97
0.95
0.6
0.58
0.57
0.57
0.57
0.57
0.55
Most Negatively Correlated Segments
proH
S1238
yisI
S639
yusW
S383
S1455
yumB
ylbC
S374
-0.49
-0.48
-0.48
-0.47
-0.47
-0.47
-0.45
-0.45
-0.44
-0.44
Expression Profile of Segment mtlA
Show/Hide
Annotation of Gene mtlA
Show/Hide
function
16.11: Scavenge (Catabolism)
function
16.1: Circulate
inference
ab initio prediction:AMIGene:2.0
codon_start
1
EC_number
2.7.1.69
transl_table
11
note
Evidence 1a: Function experimentally demonstrated in the studied strain; PubMedId: 12897001; Product type t: transporter
db_xref
GI:225184749
product
phosphotransferase system (PTS) mannitol-specific enzyme IICB component
protein_id
CAB12206.2
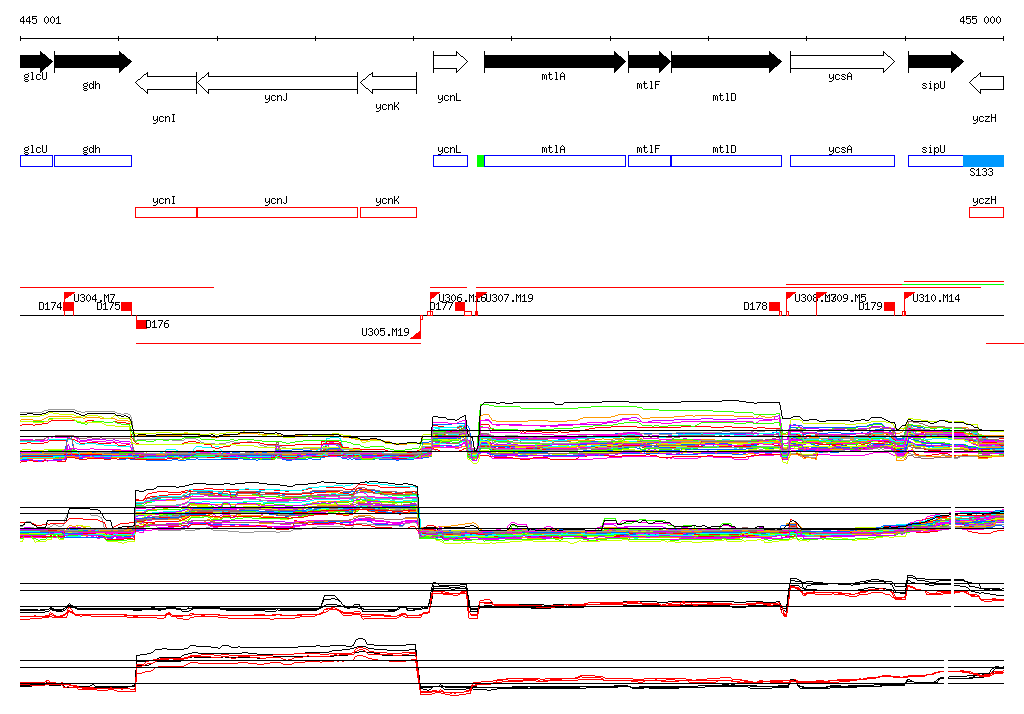
Genomic View of Gene/Segment mtlA
Show/Hide
(Legend)
Browse Genome Context