| Start Page |
|
 |
| Start Page |
|
|
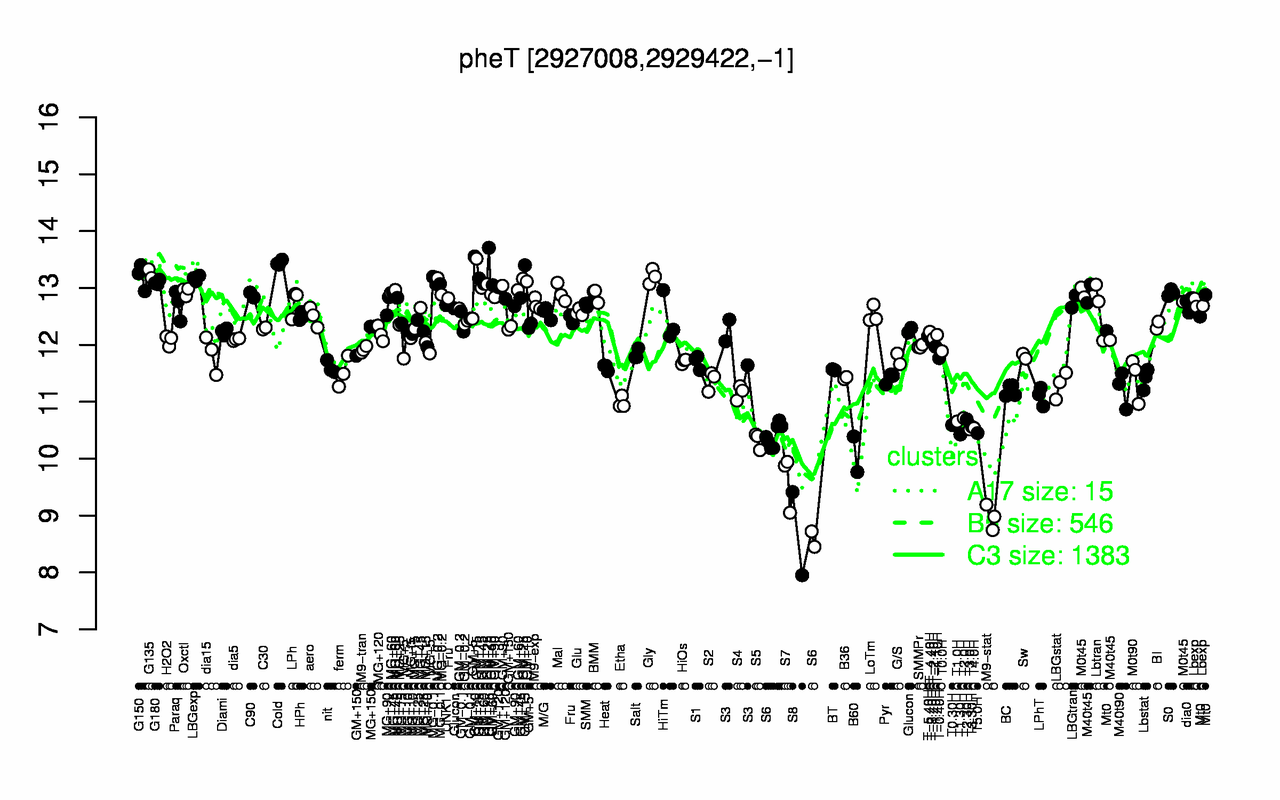
| GM+15 | Cold | GM+10 | G135 | Gly | G150 | LBGexp | GM+25 | MG-0.1 | G180 |
| 13.5 | 13.4 | 13.3 | 13.3 | 13.2 | 13.2 | 13.2 | 13.1 | 13.1 | 13.1 |
| S8 | M9-stat | S7 | S6 | B60 | S5 | T1.30H | T5.0H | T3.0H | T4.0H |
| 8.68 | 8.97 | 9.62 | 10 | 10.1 | 10.3 | 10.4 | 10.5 | 10.5 | 10.5 |