| Start Page |
|
 |
| Start Page |
|
|
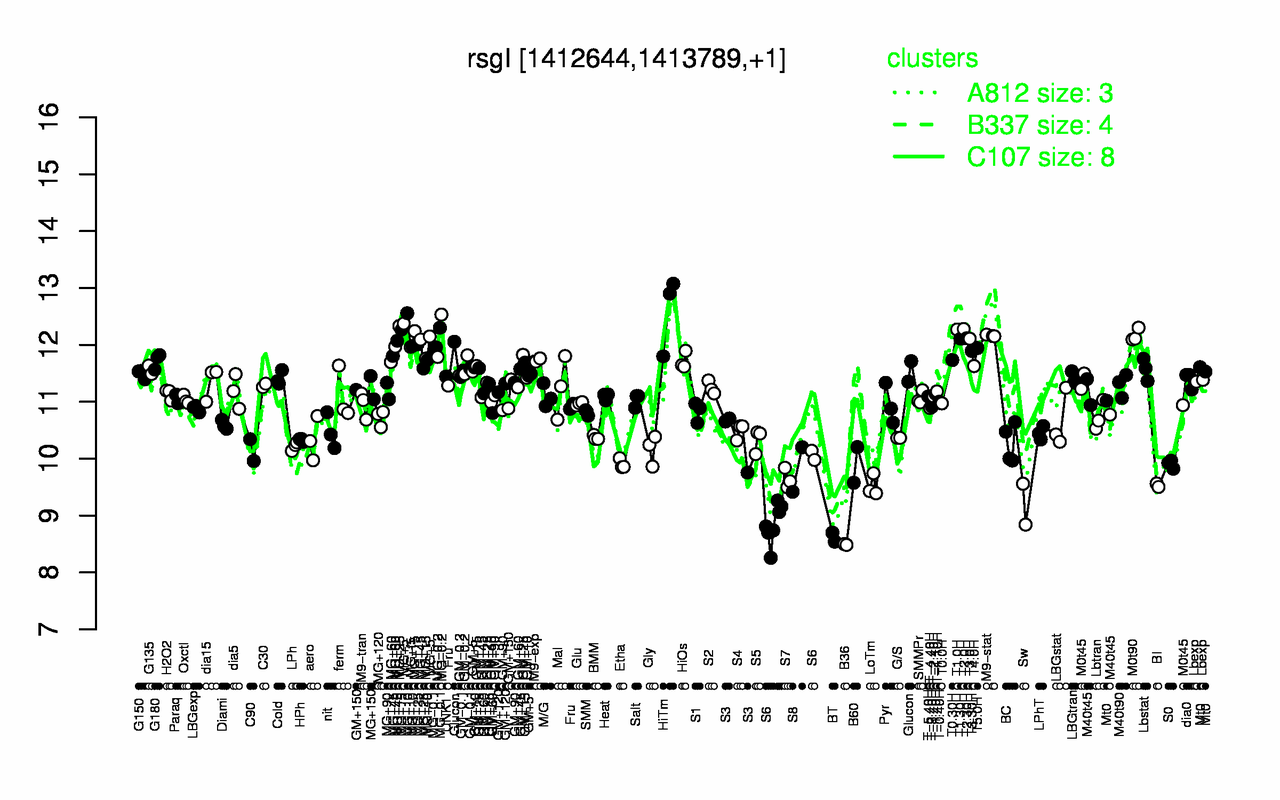
| HiTm | T2.0H | T1.0H | MG+5 | M0t90 | M9-stat | MG-0.2 | T2.30H | T1.30H | T3.0H |
| 12.6 | 12.3 | 12.3 | 12.3 | 12.2 | 12.2 | 12.2 | 12.1 | 12.1 | 12.1 |
| B36 | BT | S6 | Sw | LoTm | BI | S7 | S8 | B60 | S0 |
| 8.49 | 8.62 | 9.12 | 9.2 | 9.52 | 9.53 | 9.65 | 9.81 | 9.89 | 9.91 |