| Start Page |
|
 |
| Start Page |
|
|
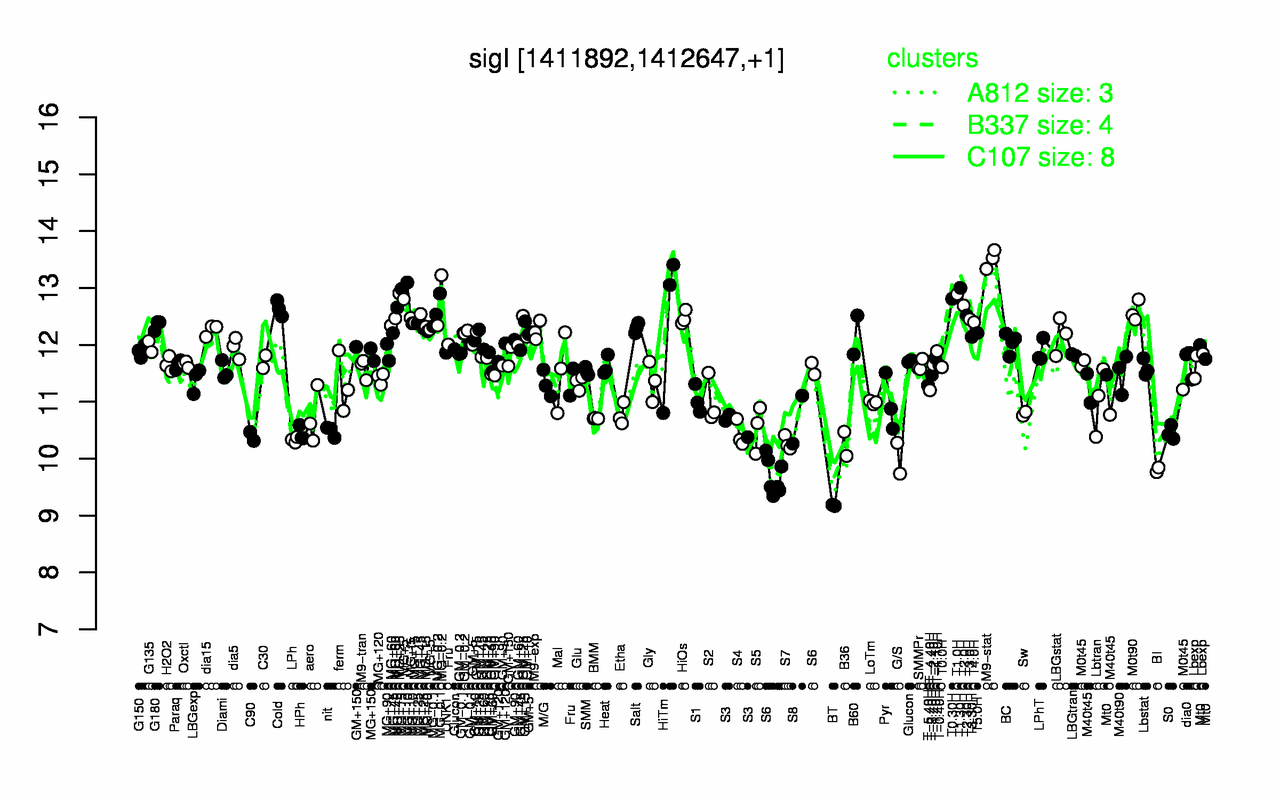
| M9-stat | T1.30H | T1.0H | T0.30H | MG-0.2 | T2.0H | Cold | M0t90 | MG-0.1 | MG+10 |
| 13.5 | 13 | 12.9 | 12.8 | 12.8 | 12.7 | 12.6 | 12.6 | 12.6 | 12.6 |
| BT | BI | G/S | S6 | B36 | S7 | LPh | C90 | S4 | HPh |
| 9.18 | 9.8 | 10 | 10.1 | 10.3 | 10.3 | 10.3 | 10.4 | 10.4 | 10.4 |