| Start Page |
|
 |
| Start Page |
|
|
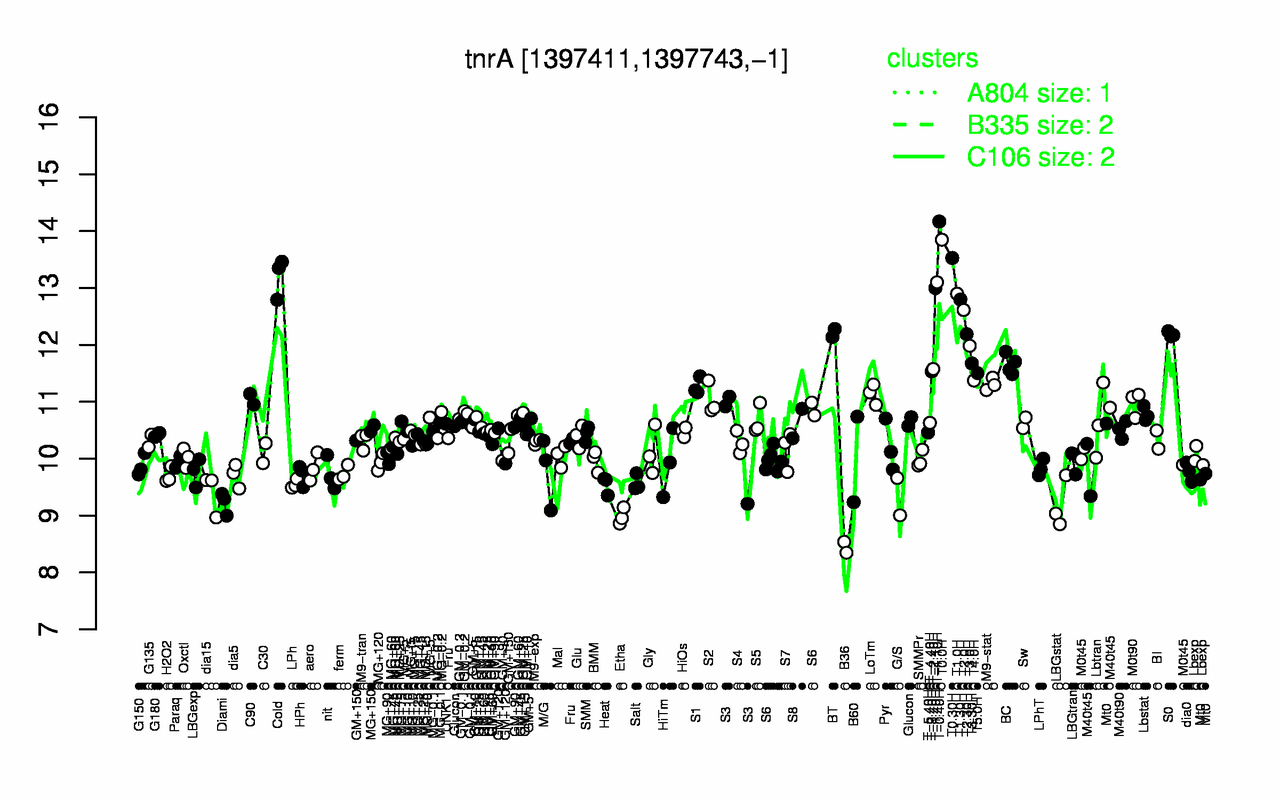
| T-0.40H | T0.0H | T0.30H | Cold | T-1.10H | T-1.40H | T1.0H | T1.30H | T2.0H | BT |
| 14.2 | 13.8 | 13.5 | 13.2 | 13.1 | 13 | 12.9 | 12.8 | 12.6 | 12.2 |
| B36 | Etha | LBGstat | Diami | G/S | dia15 | Heat | LPh | Salt | H2O2 |
| 8.44 | 8.99 | 9.2 | 9.22 | 9.33 | 9.4 | 9.54 | 9.55 | 9.58 | 9.7 |