B. subtilis Expression Data Browser
Details about ydcS Show/Hide
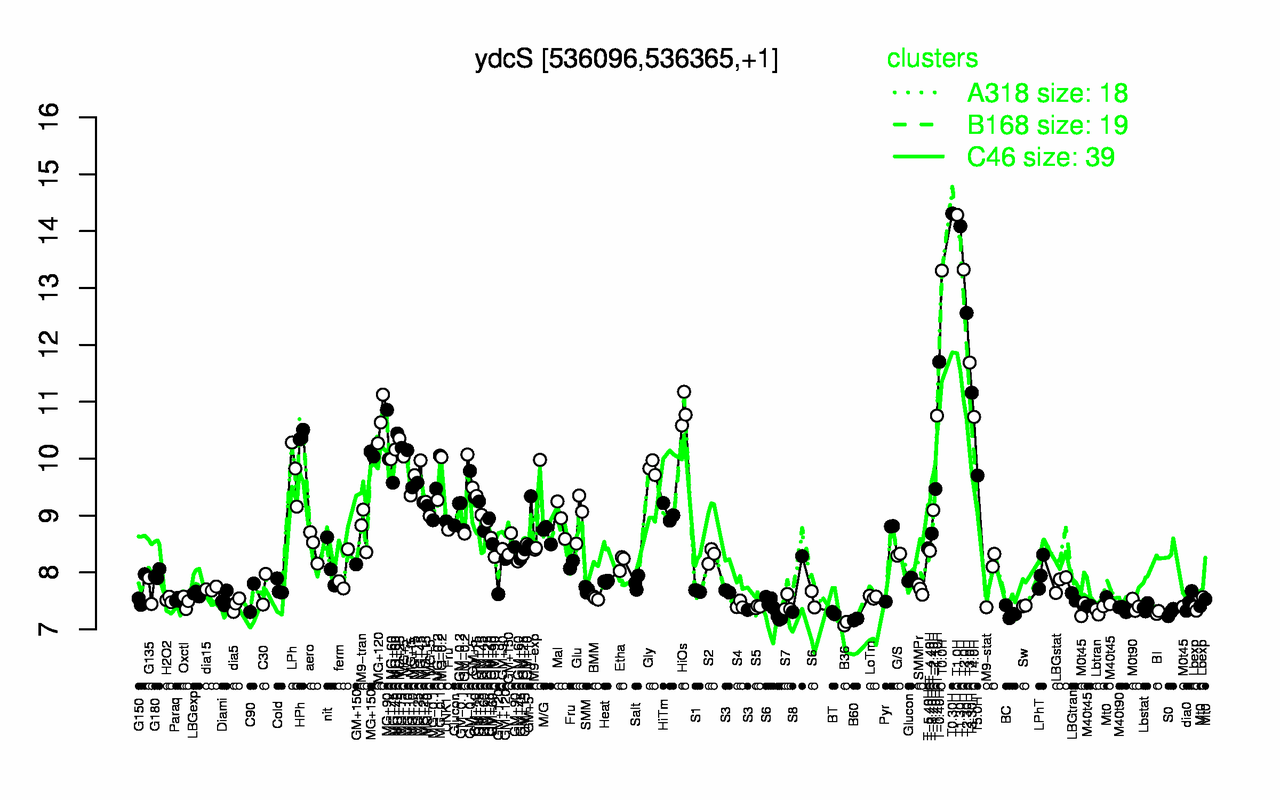
Highest Expression Conditions
T0.30H T1.0H T1.30H T2.0H T0.0H T2.30H T-0.40H T3.0H T3.30H HiOs
14.3 14.3 14.1 13.3 13.3 12.6 11.7 11.7 11.2 10.8
Lowest Expression Conditions
B36 B60 BT BC BI S0 Lbtran M40t90 M0t45 Lbstat
7.1 7.17 7.28 7.29 7.3 7.3 7.34 7.36 7.36 7.39
Most Positively Correlated Segments
ydcR S172 yddA yddC ydcT yddD ydcQ yddB yddE yddF
0.99 0.99 0.99 0.99 0.99 0.98 0.98 0.97 0.96 0.96
Most Negatively Correlated Segments
ymfH ymfF S344 ytpB S603 ymfI dtpT yhaN yfkO yvaG
-0.59 -0.56 -0.51 -0.5 -0.49 -0.48 -0.48 -0.48 -0.47 -0.47
Expression Profile of Segment ydcS Show/Hide
Annotation of Gene ydcS Show/Hide
inference
ab initio prediction:AMIGene:2.0
codon_start
1
product
conserved hypothetical protein; mobile element region
transl_table
11
note
Evidence 4: Homologs of previously reported genes of unknown function
db_xref
GI:2632788
protein_id
CAB12295.1
Genomic View of Gene/Segment ydcS Show/Hide
(Legend)