| Start Page |
|
 |
| Start Page |
|
|
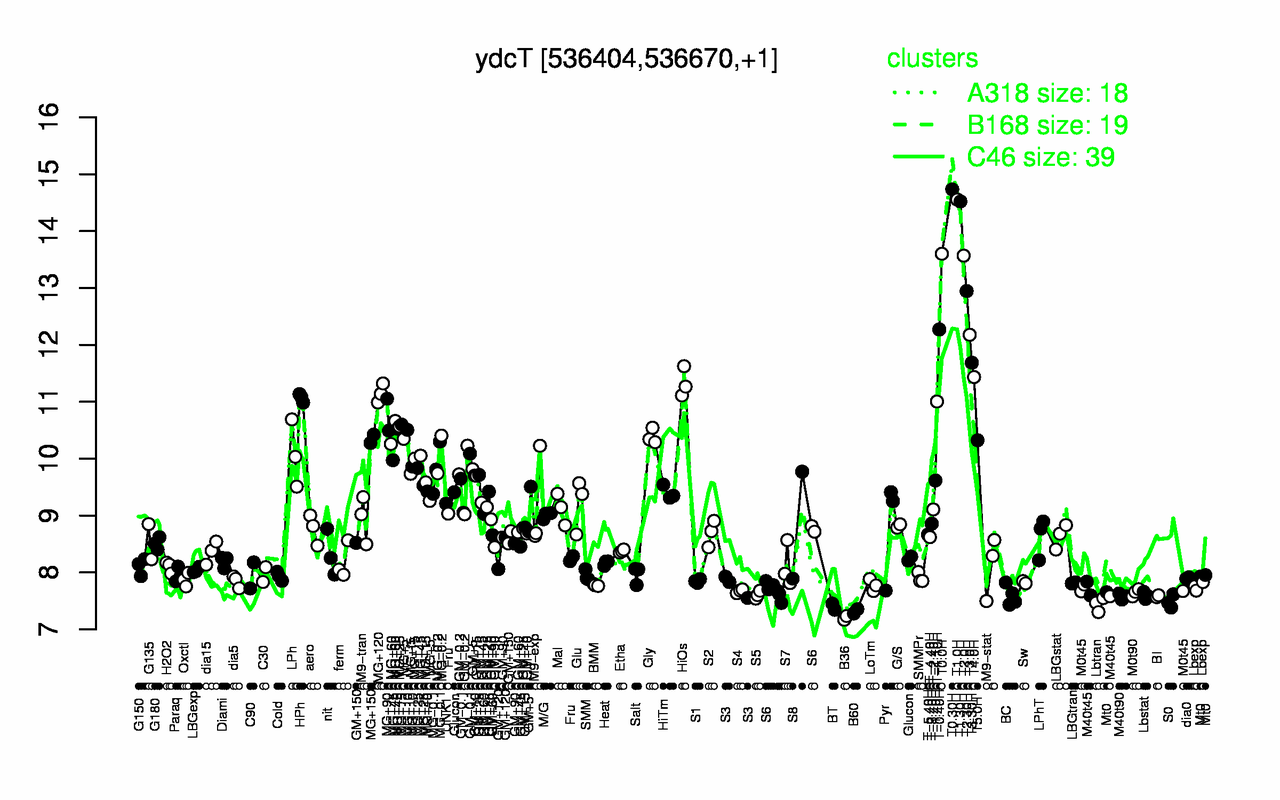
| T0.30H | T1.0H | T1.30H | T0.0H | T2.0H | T2.30H | T-0.40H | T3.0H | T3.30H | T4.0H |
| 14.7 | 14.6 | 14.5 | 13.6 | 13.6 | 12.9 | 12.3 | 12.2 | 11.7 | 11.4 |
| B36 | B60 | BT | Lbtran | S0 | M40t90 | BI | Lbstat | BC | S5 |
| 7.2 | 7.32 | 7.4 | 7.44 | 7.49 | 7.58 | 7.58 | 7.59 | 7.59 | 7.61 |