| Start Page |
|
 |
| Start Page |
|
|
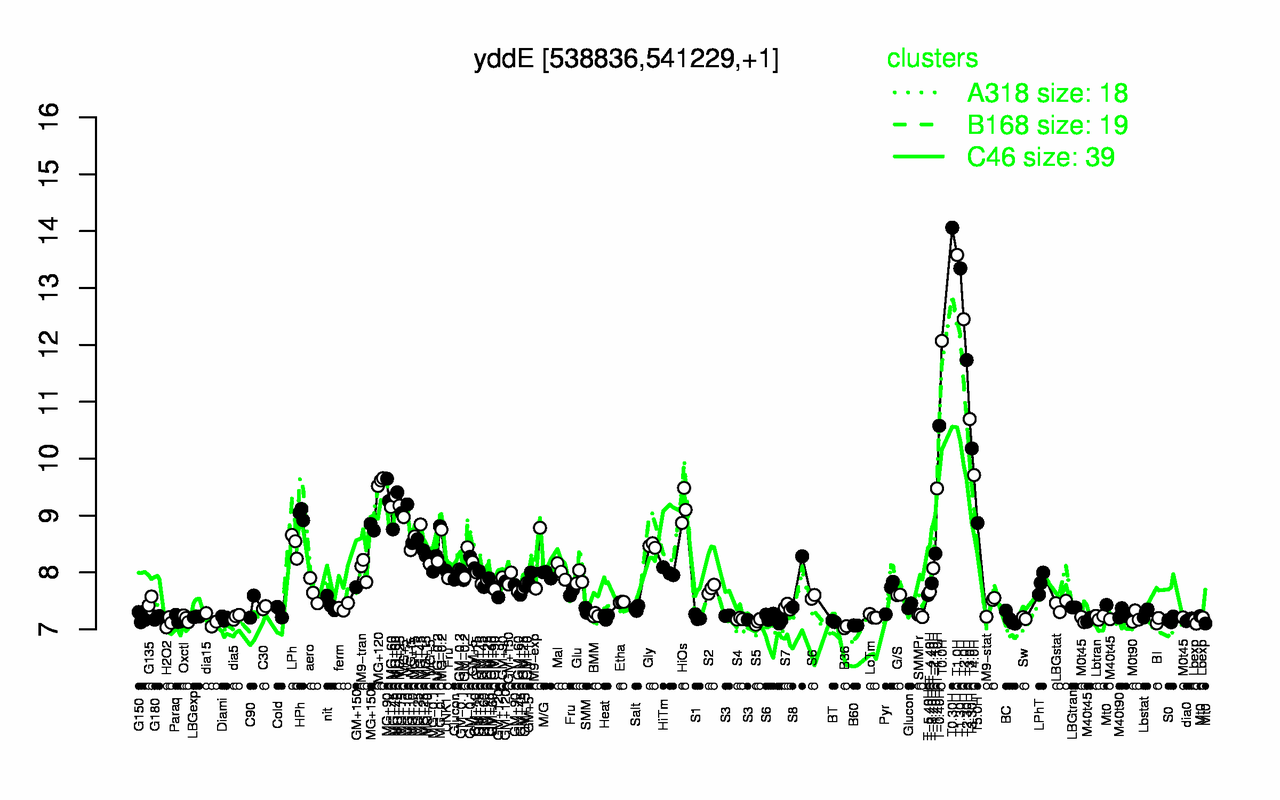
| T0.30H | T1.0H | T1.30H | T2.0H | T0.0H | T2.30H | T3.0H | T-0.40H | T3.30H | T4.0H |
| 14.1 | 13.6 | 13.3 | 12.5 | 12.1 | 11.7 | 10.7 | 10.6 | 10.2 | 9.71 |
| B36 | B60 | H2O2 | S5 | BT | BI | dia15 | Lbexp | dia0 | S0 |
| 7.04 | 7.07 | 7.12 | 7.13 | 7.14 | 7.15 | 7.16 | 7.16 | 7.17 | 7.17 |