| Start Page |
|
 |
| Start Page |
|
|
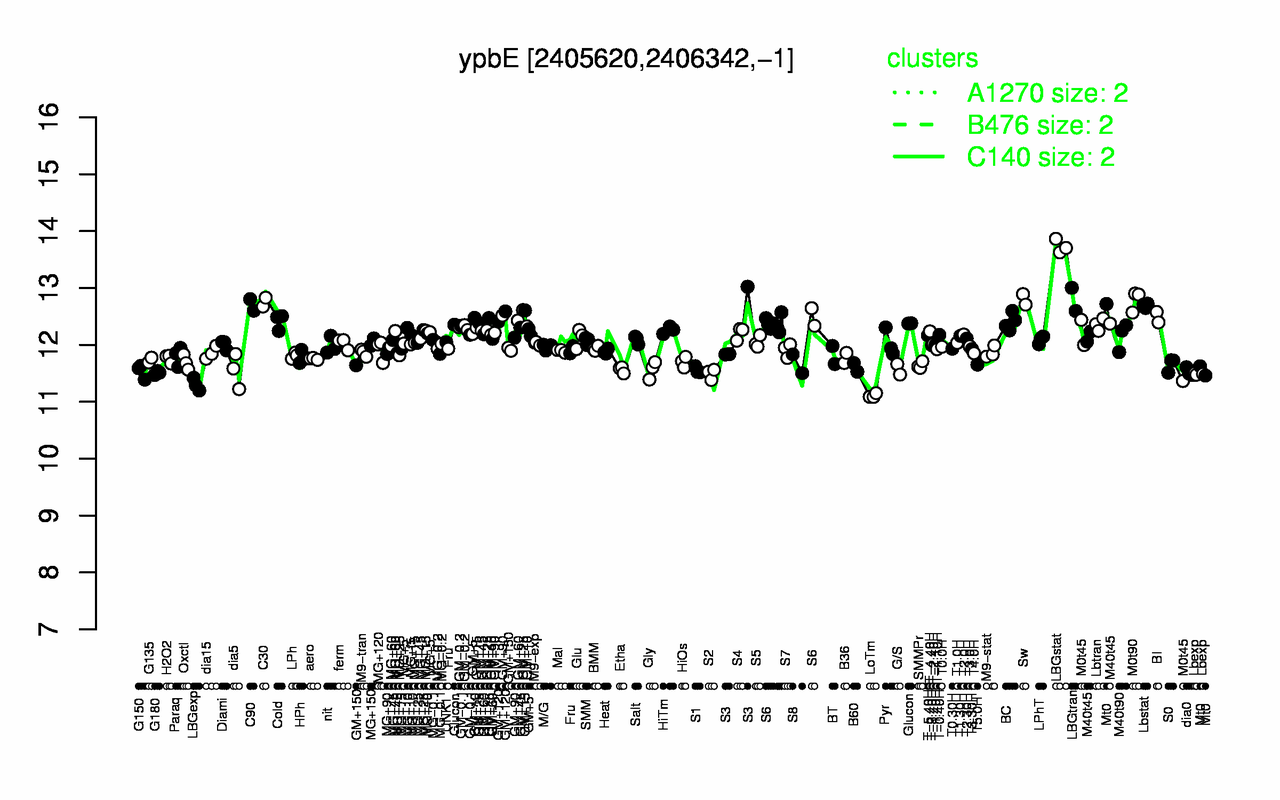
| LBGstat | Sw | LBGtran | M0t90 | C30 | C90 | Lbstat | GM+120 | BI | GM+15 |
| 13.7 | 12.8 | 12.8 | 12.8 | 12.8 | 12.7 | 12.7 | 12.5 | 12.5 | 12.5 |
| LoTm | LBGexp | Lbexp | S2 | G180 | dia0 | G150 | dia5 | S1 | Gly |
| 11.1 | 11.3 | 11.5 | 11.5 | 11.5 | 11.5 | 11.5 | 11.5 | 11.6 | 11.6 |