| Start Page |
|
 |
| Start Page |
|
|
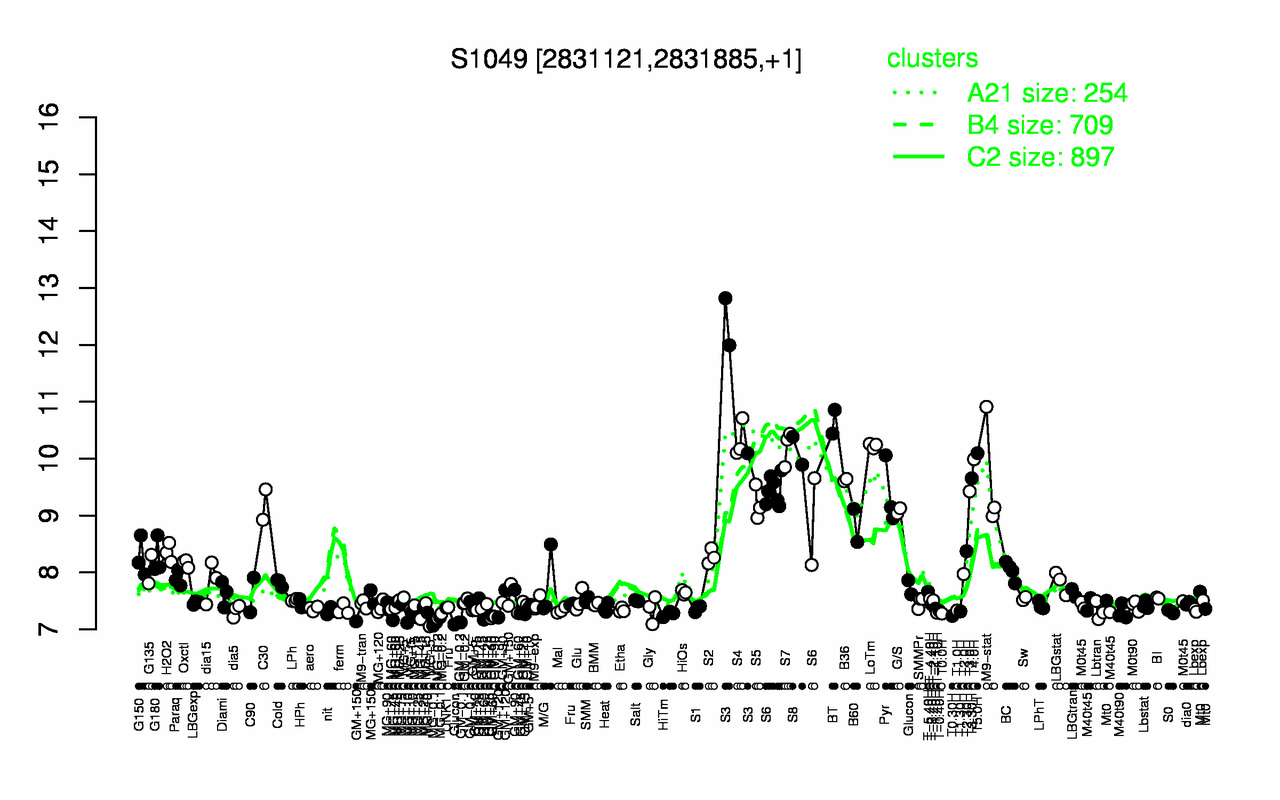
| S3 | BT | S4 | LoTm | S7 | S8 | T5.0H | T4.0H | M9-stat | T3.30H |
| 11.6 | 10.6 | 10.3 | 10.2 | 10.2 | 10.1 | 10.1 | 9.99 | 9.68 | 9.65 |
| MG-0.1 | GM+60 | MG-0.2 | T0.30H | MG+10 | HiTm | MG+45 | GM+15 | GM+45 | T0.0H |
| 7.14 | 7.23 | 7.23 | 7.24 | 7.24 | 7.27 | 7.28 | 7.28 | 7.28 | 7.28 |