B. subtilis Expression Data Browser
Details about S1096 Show/Hide
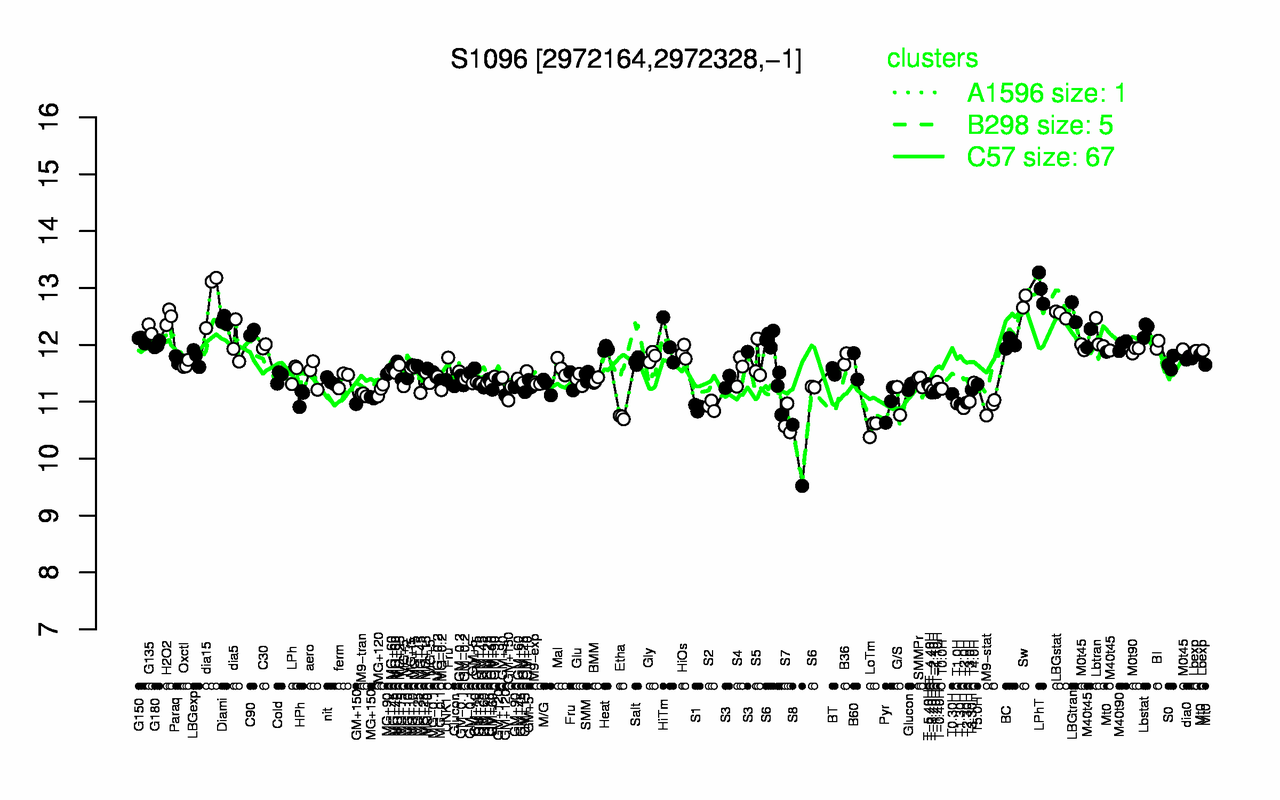
Highest Expression Conditions
LPhT dia15 Sw LBGtran LBGstat H2O2 Diami G135 Lbstat C90
13 12.9 12.8 12.6 12.5 12.5 12.4 12.3 12.3 12.2
Lowest Expression Conditions
S8 LoTm S7 Etha T2.0H S1 M9-stat S2 T1.30H Pyr
10.1 10.5 10.7 10.7 10.9 10.9 10.9 10.9 10.9 11
Most Positively Correlated Segments
mutM mutSB polA adhA yttB yqjM dnaE ywhD crh whiA
0.84 0.72 0.72 0.72 0.69 0.69 0.68 0.68 0.67 0.67
Most Negatively Correlated Segments
argC argJ argG argB safA S1056 S909 nadA argD carA
-0.63 -0.63 -0.62 -0.62 -0.62 -0.62 -0.61 -0.61 -0.61 -0.61
Expression Profile of Segment S1096 Show/Hide
Genomic View of Gene/Segment S1096 Show/Hide
(Legend)