B. subtilis Expression Data Browser
Start Page
B. subtilis Expression Data Browser
Gene/Segment:
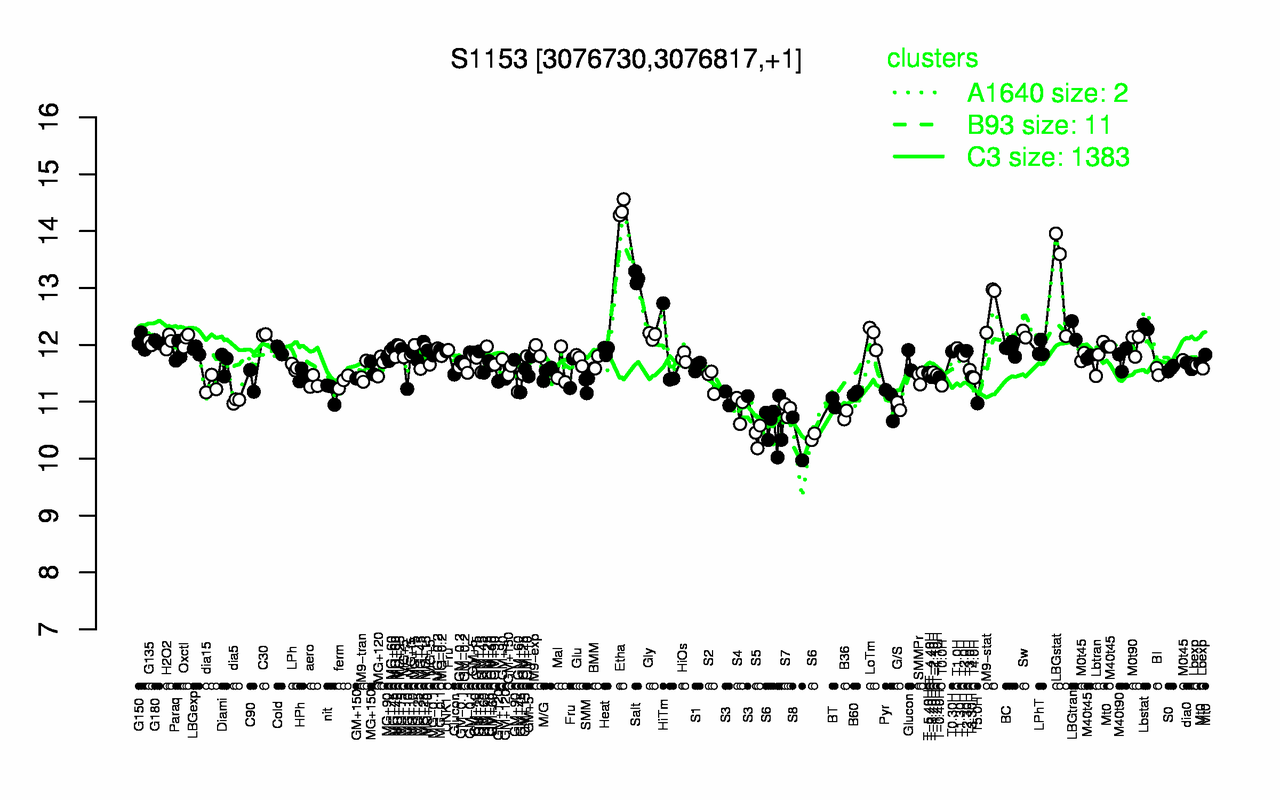
S1153
Locus Tag:
new_3076730_3076817
Details about S1153
Show/Hide
Highest Expression Conditions
Etha
LBGstat
Salt
M9-stat
Lbstat
LBGtran
Sw
C30
Gly
LoTm
14.4
13.2
13.2
12.7
12.3
12.3
12.2
12.2
12.2
12.1
Lowest Expression Conditions
S8
S5
S6
B36
S7
S4
G/S
T5.0H
BT
Pyr
10.3
10.4
10.5
10.8
10.9
10.9
10.9
11
11
11
Most Positively Correlated Segments
opuD
ygxA
yisP
menE
menC
S389
ykuT
ydbD
yrhK
sipT
0.86
0.8
0.78
0.76
0.75
0.74
0.73
0.71
0.7
0.7
Most Negatively Correlated Segments
ycgL
bcsA
ykuS
S380
spoIVCB
gerPA
yisY
sspM
ypzF
S832
-0.64
-0.63
-0.62
-0.62
-0.61
-0.61
-0.61
-0.61
-0.61
-0.61
Expression Profile of Segment S1153
Show/Hide
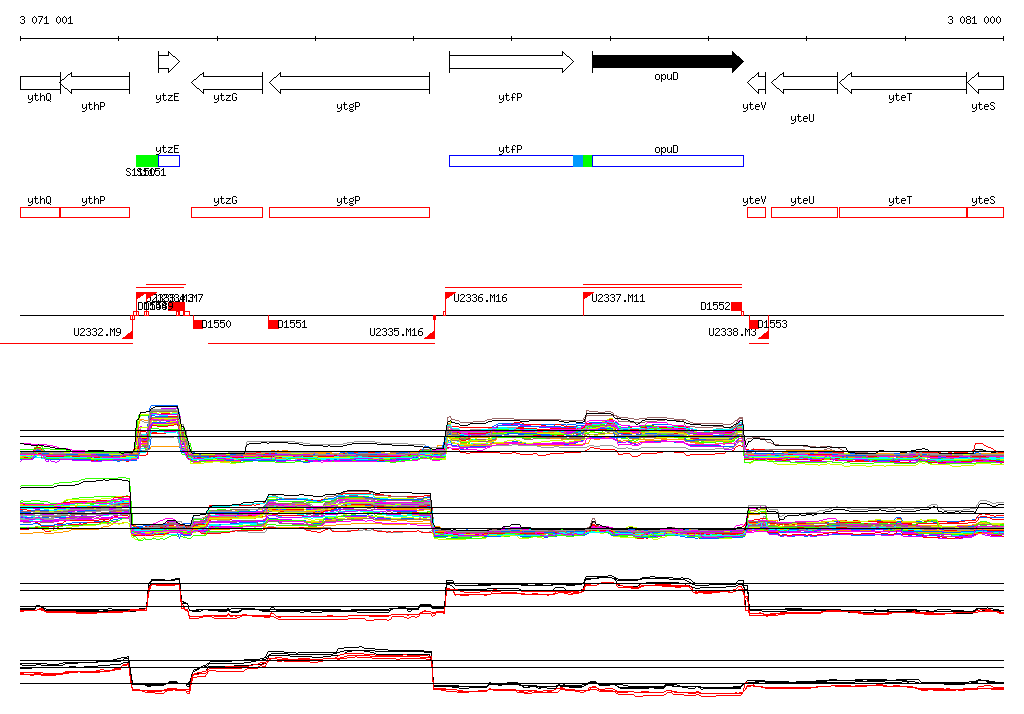
Genomic View of Gene/Segment S1153
Show/Hide
(Legend)
Browse Genome Context