B. subtilis Expression Data Browser
Start Page
B. subtilis Expression Data Browser
Gene/Segment:
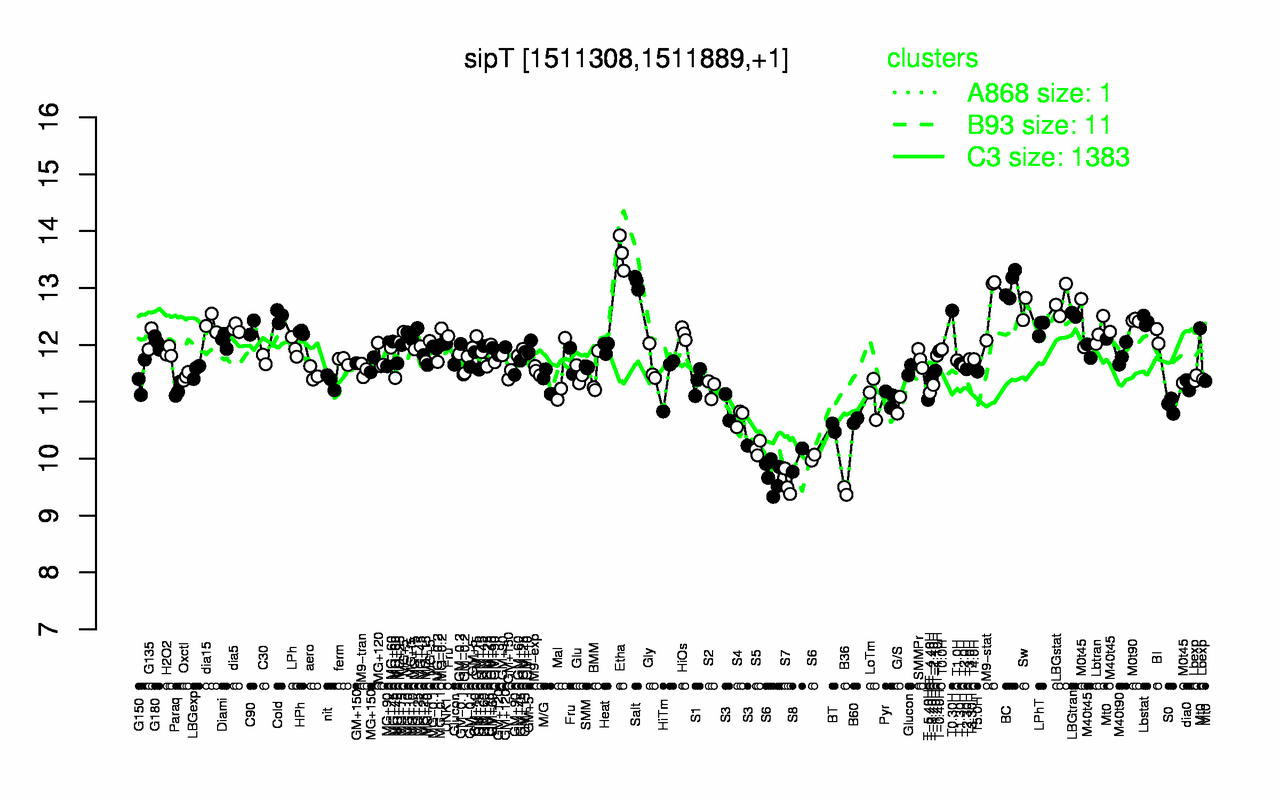
sipT
Locus Tag:
BSU14410
Details about sipT
Show/Hide
Highest Expression Conditions
Etha
Salt
BC
LBGstat
M9-stat
Sw
T0.30H
LBGtran
Cold
M0t90
13.6
13.1
13
12.8
12.8
12.6
12.6
12.5
12.5
12.4
Lowest Expression Conditions
B36
S7
S6
S8
S5
BT
B60
S3
S4
S0
9.43
9.57
9.79
9.97
10.2
10.5
10.7
10.7
10.7
10.9
Most Positively Correlated Segments
ydcG
rapJ
ypbB
aroC
sigZ
yjbI
yhaH
addB
S167
bceS
0.78
0.78
0.78
0.78
0.78
0.77
0.76
0.76
0.76
0.76
Most Negatively Correlated Segments
asnO
yqfQ
S388
ysnD
yodH
yjzK
yhjR
S387
ykuS
yutG
-0.75
-0.75
-0.75
-0.75
-0.74
-0.74
-0.74
-0.74
-0.74
-0.74
Expression Profile of Segment sipT
Show/Hide
Annotation of Gene sipT
Show/Hide
function
16.1: Circulate
function
16.6: Maintain
inference
ab initio prediction:AMIGene:2.0
codon_start
1
EC_number
3.4.21.89
transl_table
11
note
Evidence 1a: Function experimentally demonstrated in the studied strain; PubMedId: 10198007, 11283286, 12897006, 9325333; Product type e: enzyme
db_xref
GI:2633812
product
type I signal peptidase
protein_id
CAB13314.1
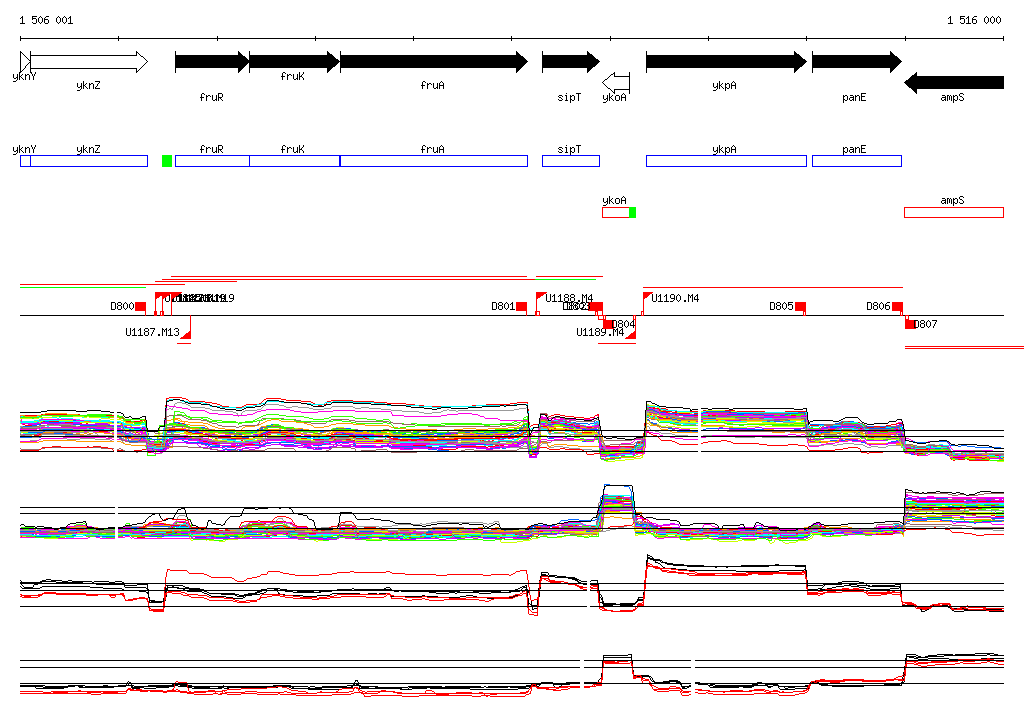
Genomic View of Gene/Segment sipT
Show/Hide
(Legend)
Browse Genome Context