| Start Page |
|
 |
| Start Page |
|
|
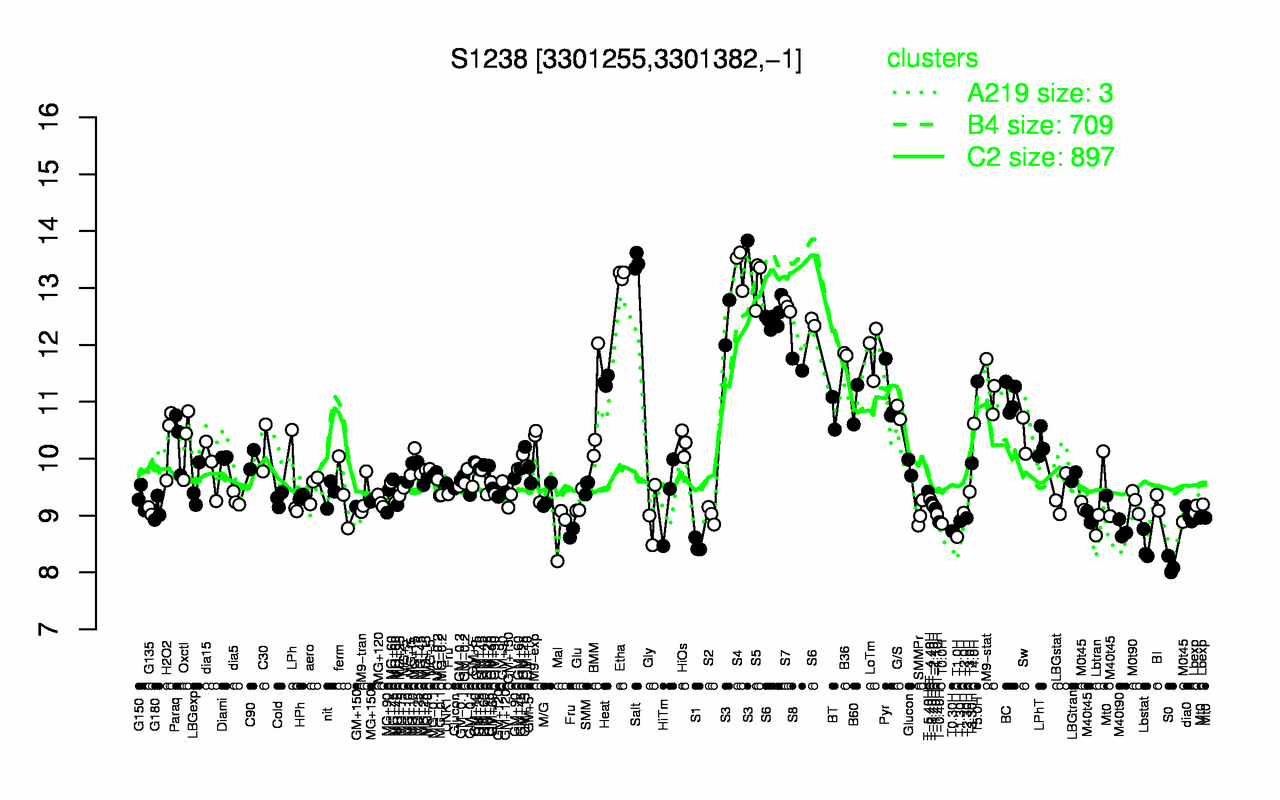
| Salt | S4 | Etha | S5 | S3 | S7 | S6 | LoTm | B36 | S8 |
| 13.5 | 13.4 | 13.2 | 13.1 | 12.9 | 12.7 | 12.5 | 11.9 | 11.8 | 11.7 |
| S0 | Lbstat | S1 | T1.0H | T0.30H | Mal | M40t90 | T0.0H | T-0.40H | T1.30H |
| 8.13 | 8.46 | 8.48 | 8.62 | 8.73 | 8.74 | 8.76 | 8.86 | 8.89 | 8.9 |